HOT TOPICS LIST
- MACD
- Fibonacci
- RSI
- Gann
- ADXR
- Stochastics
- Volume
- Triangles
- Futures
- Cycles
- Volatility
- ZIGZAG
- MESA
- Retracement
- Aroon
INDICATORS LIST
LIST OF TOPICS
PRINT THIS ARTICLE
by Koos van der Merwe
Xerox Corporation raised its full year outlook, citing second quarter performance and strong demand for Xerox's new technology and value-added services.
Position: Accumulate
Koos van der Merwe
Has been a technical analyst since 1969, and has worked as a futures and options trader with First Financial Futures in Johannesburg, South Africa.
PRINT THIS ARTICLE
VOLUME INDICATOR
The Copy Book Recovery Of Xerox
07/28/04 01:37:21 PMby Koos van der Merwe
Xerox Corporation raised its full year outlook, citing second quarter performance and strong demand for Xerox's new technology and value-added services.
Position: Accumulate
| On December 8, 2000 the share price of Xerox hit an intraday low of $3.75, and this after a high reached of $29.31 on March 17th that same year. The company looked at itself, corrected its shortcomings, and the share price started to recover, slowly. Almost four years later, on February 13th, the share price of the company closed at $15.05. Was Xerox riding on the tails of a recovering bull market, or has its cost cutting, and general restructuring been the reason for this recovery. If it is the latter, then is Xerox worth buying today? |
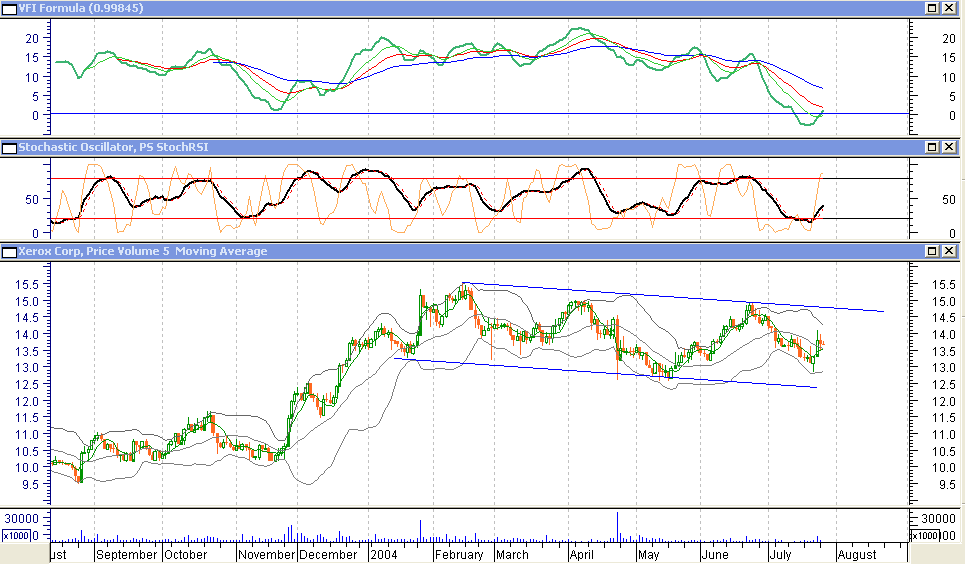
| The chart I am looking at has a fair number of indicators on it that are all telling us something. a. VFI Formula. Markos Katsanos introduced The Volume Flow Indicator (VFI) in the June 2004 issue of Technical Analysis of Stocks & Commodities. I have always believed that volume played an integral part in forecasting the movement of a stock, and I liked VFI so much that it is now an integral part of my analysis. I have placed three moving averages on the indicator, although Markos has suggested using only the 50 day moving average. The averages are all exponential, and are a 10 day (green), 20 day (red) and the 50-day (blue). By crossing the zero base line, the VFI indicator has given a buy signal, a signal confirmed by the break above the 10-day moving average. The approach to the 20-day moving average is further encouragement. I use the 10-day and 20-day moving averages for short term trading. |

|
| XEROX |
| Graphic provided by: MetaStock. |
| |
| b. In the second indicator window, I have shown a stochastic oscillator (black) and a Stochastic/RSI indicator (red ). Both are oscillators, which suggests duplication, but I have found the Stochastic/RSI indicator to be more volatile, and an early warning indicator, confirmed by the slower moving stochastic oscillator. Both are showing strong buy signals. |
| c. The chart of the price itself shows Bollinger bands, trend lines and color coded price bars of the VFI. Bollinger bands are suggesting that the next move is up as the price bars are at the lower Bollinger band. The color coded price bars are red, and are suggesting a sideways move. The two trend lines are suggesting that Xerox could be forming a flag pattern. A break above the upper trend line would therefore give a target of between $17 to $18 depending on when the upper trend line is broken. |
| To conclude, Xerox is very definitely a share that could be accumulated at these levels. |
Has been a technical analyst since 1969, and has worked as a futures and options trader with First Financial Futures in Johannesburg, South Africa.
| Address: | 3256 West 24th Ave |
| Vancouver, BC | |
| Phone # for sales: | 6042634214 |
| E-mail address: | petroosp@gmail.com |
Click here for more information about our publications!
Comments

|

Request Information From Our Sponsors
- StockCharts.com, Inc.
- Candle Patterns
- Candlestick Charting Explained
- Intermarket Technical Analysis
- John Murphy on Chart Analysis
- John Murphy's Chart Pattern Recognition
- John Murphy's Market Message
- MurphyExplainsMarketAnalysis-Intermarket Analysis
- MurphyExplainsMarketAnalysis-Visual Analysis
- StockCharts.com
- Technical Analysis of the Financial Markets
- The Visual Investor
- VectorVest, Inc.
- Executive Premier Workshop
- One-Day Options Course
- OptionsPro
- Retirement Income Workshop
- Sure-Fire Trading Systems (VectorVest, Inc.)
- Trading as a Business Workshop
- VectorVest 7 EOD
- VectorVest 7 RealTime/IntraDay
- VectorVest AutoTester
- VectorVest Educational Services
- VectorVest OnLine
- VectorVest Options Analyzer
- VectorVest ProGraphics v6.0
- VectorVest ProTrader 7
- VectorVest RealTime Derby Tool
- VectorVest Simulator
- VectorVest Variator
- VectorVest Watchdog
