HOT TOPICS LIST
- MACD
- Fibonacci
- RSI
- Gann
- ADXR
- Stochastics
- Volume
- Triangles
- Futures
- Cycles
- Volatility
- ZIGZAG
- MESA
- Retracement
- Aroon
INDICATORS LIST
LIST OF TOPICS
PRINT THIS ARTICLE
by Gary Grosschadl
After doubling in price in three months, a retracement is no surprise.
Position: N/A
Gary Grosschadl
Independent Canadian equities trader and technical analyst based in Peterborough
Ontario, Canada.
PRINT THIS ARTICLE
RETRACEMENT
Kmart Retracement
07/28/04 02:11:10 PMby Gary Grosschadl
After doubling in price in three months, a retracement is no surprise.
Position: N/A
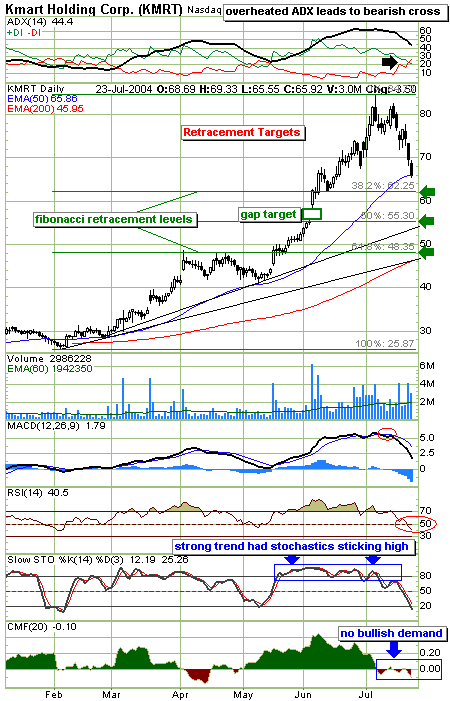
| Several weeks ago this stock peaked just above $84. This retracemment has shaved off 20 percent. How much further can it go? Currently KMRT has come down to its 50-day EMA. A bounce here could be possible but there is no candlestick pattern yet that suggests such a move. Back in May there was a retracement to the 50 EMA with a corresponding move off the stochastic 20 level. Similar circumstances exist now but the downdraft has been swifter. |
| To gauge how much farther this retracement could likely go, I added Fibonacci retracement levels to the chart. Using the low and high of the chart, I plotted the most common Fibonacci levels of roughly one third, one half and two thirds. Stocks often have a tendancy to retrace to those mathematical levels before making a reversal attempt. |

|
| Kmart in the throes of retracement. |
| Graphic provided by: stockcharts.com. |
| |
| I prefer to see those levels match up with other strategic points on a chart, to give them more credence. And they do. The 38.2% mark coincides with a separate top and bottom of large candlesticks, the 50% mark relates to the bottom of a previous gap and is near a trendline of support. The 61.8% retracement lines up with a previous resistance level and is near the trendline and 200 EMA support. |
| Several indicators are worth commenting on. At the top of the chart, the DI components of the Directional Movement Indicator have just crossed bearishly. This indicates that bearish power has the upper hand. The MACD (moving average convergence/divergence) shows a previous bearish cross and is still heading down. The last retracement was halted at the 0 line so this could be the target here as well. The RSI (relative strength indicator) has a very bearish stance here as it breaks the often critical 50 level. The stochastic level is very near typical oversold levels at or below this 20 level. This hints at a bounce occurring soon. The CMF (Chaiken Money Flow) shows a state of poor bullish demand. Note how this was a timely warning at the recent top suggesting that weak demand would not carry the stock any higher, a good argument for a reversal. |
| In summary, traders should be on the alert for possible bounces at or near the Fibonacci levels as presented on the chart. The danger is that the 50 EMA line may cut any bounce short as this could become an important overhead resistance. As always time will tell. |
Independent Canadian equities trader and technical analyst based in Peterborough
Ontario, Canada.
| Website: | www.whatsonsale.ca/financial.html |
| E-mail address: | gwg7@sympatico.ca |
Click here for more information about our publications!
PRINT THIS ARTICLE

Request Information From Our Sponsors
- StockCharts.com, Inc.
- Candle Patterns
- Candlestick Charting Explained
- Intermarket Technical Analysis
- John Murphy on Chart Analysis
- John Murphy's Chart Pattern Recognition
- John Murphy's Market Message
- MurphyExplainsMarketAnalysis-Intermarket Analysis
- MurphyExplainsMarketAnalysis-Visual Analysis
- StockCharts.com
- Technical Analysis of the Financial Markets
- The Visual Investor
- VectorVest, Inc.
- Executive Premier Workshop
- One-Day Options Course
- OptionsPro
- Retirement Income Workshop
- Sure-Fire Trading Systems (VectorVest, Inc.)
- Trading as a Business Workshop
- VectorVest 7 EOD
- VectorVest 7 RealTime/IntraDay
- VectorVest AutoTester
- VectorVest Educational Services
- VectorVest OnLine
- VectorVest Options Analyzer
- VectorVest ProGraphics v6.0
- VectorVest ProTrader 7
- VectorVest RealTime Derby Tool
- VectorVest Simulator
- VectorVest Variator
- VectorVest Watchdog
