HOT TOPICS LIST
- MACD
- Fibonacci
- RSI
- Gann
- ADXR
- Stochastics
- Volume
- Triangles
- Futures
- Cycles
- Volatility
- ZIGZAG
- MESA
- Retracement
- Aroon
INDICATORS LIST
LIST OF TOPICS
PRINT THIS ARTICLE
by Gary Grosschadl
This Canadian Energy Index has been lagging its American counterparts and now hints at wanting to go higher.
Position: Hold
Gary Grosschadl
Independent Canadian equities trader and technical analyst based in Peterborough
Ontario, Canada.
PRINT THIS ARTICLE
ASCENDING TRIANGLES
TSX Energy Index Testing A Breakout Level
07/28/04 02:06:18 PMby Gary Grosschadl
This Canadian Energy Index has been lagging its American counterparts and now hints at wanting to go higher.
Position: Hold
| This index is made up of Canadian energy sector companies in the Toronto Stock Exchange (TSX formerly TSE). It is capped in that the weight of any one company is limited to 25% in terms of market capitilisation. |
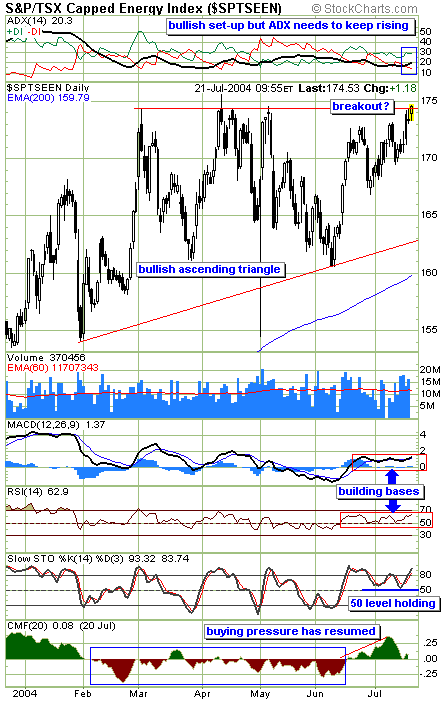
| The daily chart shows the formation of a large five month ascending triangle. Ascending triangles tend to be bullish. As the pattern suggests, the downside range tightens up as the bears have less power to bring the stock down. Eventually the bulls sense the shift in sentiment and a breakout can ensue with the right market conditions. A positive note is that the entire formation is above the 200-day exponential moving average (EMA). |

|
| This Canadian Energy Index is testing overhead resistance. |
| Graphic provided by: stockcharts.com. |
| |
| Several indicators are suggesting that this index is turning more bullish. The Directional Movement Indicator (DMI) at the top of the chart shows the three components that it encompasses. The ideal bullish scenario for this trend strength indicator is to have the ADX line upsloping between both DI's and above 25. Currently the ADX (20.3) needs to improve for added bullishness. The MACD (moving average convergence/divergence) indicator and the RSI (relative strength index) both show bases being formed above what are often key levels. The stochastics indicator shows some bullish consolidation above its 50 level. Finally, the CMF (Chaiken Money Flow) Indicator shows an overall shift to some bullish sentiment. It stayed mostly in negative territory throughout the ascending triangle pattern but recently shifted to the positive side, although it has weakened again somewhat. |
| In summary, this pattern bears watching as the breakout level is being tested. Whether a breakout can occur now or the pattern needs to tighten up further remains to be seen. Look for a high volume move when the time is right, sustainable above the breakout point near 175. |
Independent Canadian equities trader and technical analyst based in Peterborough
Ontario, Canada.
| Website: | www.whatsonsale.ca/financial.html |
| E-mail address: | gwg7@sympatico.ca |
Click here for more information about our publications!
Comments

Request Information From Our Sponsors
- StockCharts.com, Inc.
- Candle Patterns
- Candlestick Charting Explained
- Intermarket Technical Analysis
- John Murphy on Chart Analysis
- John Murphy's Chart Pattern Recognition
- John Murphy's Market Message
- MurphyExplainsMarketAnalysis-Intermarket Analysis
- MurphyExplainsMarketAnalysis-Visual Analysis
- StockCharts.com
- Technical Analysis of the Financial Markets
- The Visual Investor
- VectorVest, Inc.
- Executive Premier Workshop
- One-Day Options Course
- OptionsPro
- Retirement Income Workshop
- Sure-Fire Trading Systems (VectorVest, Inc.)
- Trading as a Business Workshop
- VectorVest 7 EOD
- VectorVest 7 RealTime/IntraDay
- VectorVest AutoTester
- VectorVest Educational Services
- VectorVest OnLine
- VectorVest Options Analyzer
- VectorVest ProGraphics v6.0
- VectorVest ProTrader 7
- VectorVest RealTime Derby Tool
- VectorVest Simulator
- VectorVest Variator
- VectorVest Watchdog
