HOT TOPICS LIST
- MACD
- Fibonacci
- RSI
- Gann
- ADXR
- Stochastics
- Volume
- Triangles
- Futures
- Cycles
- Volatility
- ZIGZAG
- MESA
- Retracement
- Aroon
INDICATORS LIST
LIST OF TOPICS
PRINT THIS ARTICLE
by David Penn
A short-covering rally in the $OEX runs into resistance at the 20-, 50- and 200-day simple moving averages.
Position: N/A
David Penn
Technical Writer for Technical Analysis of STOCKS & COMMODITIES magazine, Working-Money.com, and Traders.com Advantage.
PRINT THIS ARTICLE
MOVING AVERAGES
The Moving Average Trilogy
07/22/04 04:26:05 PMby David Penn
A short-covering rally in the $OEX runs into resistance at the 20-, 50- and 200-day simple moving averages.
Position: N/A
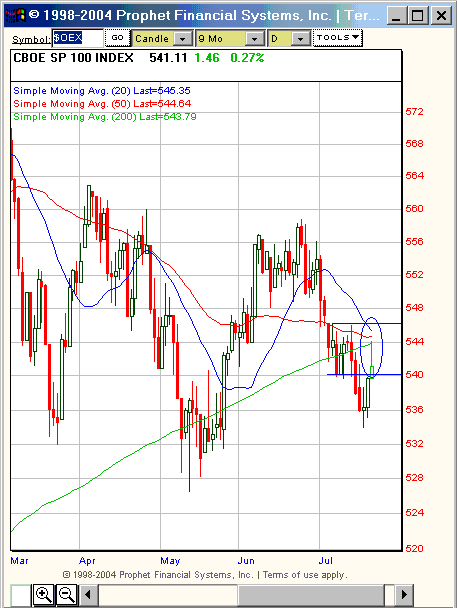
| In one of Amazon.com's reader-provided reviews of Paul Auster's postmodern collection, The New York Trilogy, a self-appointed textual analyst reports that if the various detailed and "well-described" travels the characters make through the city of New York in the course of the trilogy are actually charted on a map of the city, "spooky" picture emerges. "What does it mean?" the critic asks. "I was actually spooked." I haven't read much Auster, and can neither confirm nor deny the spookiness of any drawing that might be created by tracking the footpaths of mysterious characters in postmodern fiction. Truth told, I'm still playing my Beatles records backwards trying to find out if Paul McCartney is as dead as the conspiracy theorists say he is. So, I can provide no help with the spooky pictures from Auster. But I may be able to shine a light on the spooky picture of a short-covering rally in the S&P 100, more commonly known as the $OEX. Here, technicians and chartists will readily recognize the trilogy of simple moving averages -- a 20-day, a 50-day, and a 200-day -- that loom as powerful resistance above the $OEX's recent attempt to rally. |
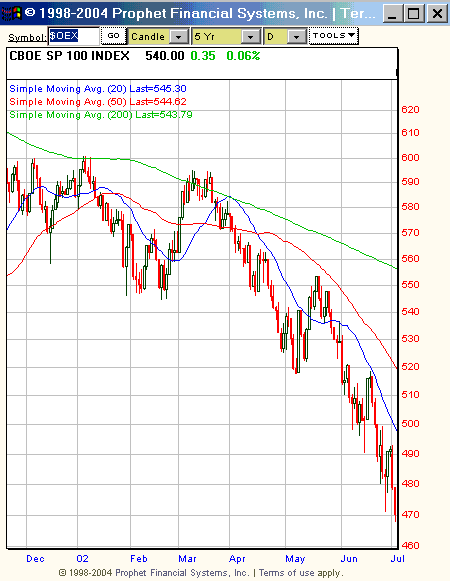
| It isn't too often that three major moving averages converge in this fashion. But the potential significance of this event should not be understated. The last time there was anything close to this kind of convergence of the 20-, 50-, and 200-day simple moving averages in the $OEX, for example, was in the spring of 2002. At the time, the market was in the very late stages of its bull run from the September 2001 lows. Then, the 200-day SMA was moving sharply downward, the 50-day SMA moving gradually downward and the 20-day, reflecting the bullishness of the six-month old rally, was moving upward. |

|
| Figure 1: The convergence of three moving averages bodes ill for a continued rally in the $OEX. |
| Graphic provided by: Prophet Financial Systems, Inc. |
| |
| And the end result was the bear market that took the $OEX into the dreaded October 2002 lows. This time, the 200-day SMA is bullish and trending higher, while the shortest SMA, the 20-day, is hooking sharply lower. This is very much the opposite of what took place in the spring of 2002, during which the short term trend was bullish and the longer term trend bearish. In both cases, the intermediate term moving average, the 50-day SMA was trending down gradually and moderately. |
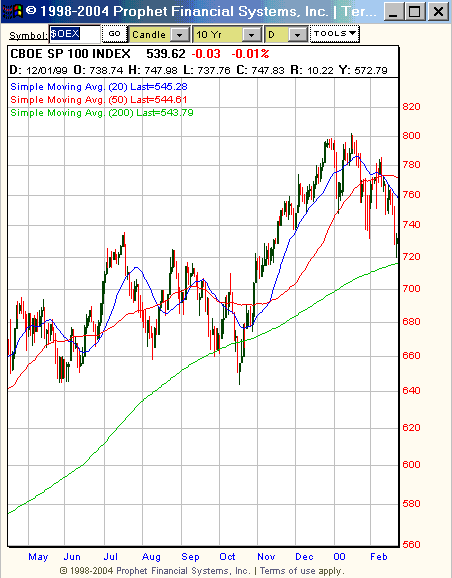
 Figure 2: The last time there was a convergence of major moving averages like this, the 20-day SMA gave way to the bearishness of the 50- and 200-day trends. So, with the 200-day SMA trending upwards in the summer of 2004, should traders and investors expect the $OEX to break out above it--as well as above the two other moving averages? The best most recent analogy for such a scenario is the $OEX market from the fall of 1999. At that time, an upwardly trending 200-day SMA--a long-term SMA that was under the 50- and 20-day moving averages--was converging with a 20-day SMA that was hooking down. The 50-day SMA was flattening somewhat, but had been moving higher going into the fall. |
 Figure 3: If the market in the summer of 2004 behaves like it did in the fall of 1999, then prices should breakout above the convergence of major moving averages and set a new high shortly thereafter. How helpful the 1999 analogy is will remain anybody's guess. Unlike the market in 1999, which was coming off a four-year/216-week cycle low from 1998, the market in 2004 has more likely just established a four-year/216-week cycle peak (the first quarter 2004 highs in the Dow Industrials, S&P 500 and 100, as well as in the Nasdaq). This made the dip below the 200-day SMA in 1999 a far more buyable event than the present dip below the 200-day SMA. In any event, a market that has seemed relatively listless and without conviction for much of the summer is likely to be displaying precisely the opposite of all that once it resolves its current mystery of the moving average trilogy. Note: I'm long OEX puts at the time of this writing. |
Technical Writer for Technical Analysis of STOCKS & COMMODITIES magazine, Working-Money.com, and Traders.com Advantage.
| Title: | Technical Writer |
| Company: | Technical Analysis, Inc. |
| Address: | 4757 California Avenue SW |
| Seattle, WA 98116 | |
| Phone # for sales: | 206 938 0570 |
| Fax: | 206 938 1307 |
| Website: | www.Traders.com |
| E-mail address: | DPenn@traders.com |
Traders' Resource Links | |
| Charting the Stock Market: The Wyckoff Method -- Books | |
| Working-Money.com -- Online Trading Services | |
| Traders.com Advantage -- Online Trading Services | |
| Technical Analysis of Stocks & Commodities -- Publications and Newsletters | |
| Working Money, at Working-Money.com -- Publications and Newsletters | |
| Traders.com Advantage -- Publications and Newsletters | |
| Professional Traders Starter Kit -- Software | |
Click here for more information about our publications!
Comments

|

Request Information From Our Sponsors
- VectorVest, Inc.
- Executive Premier Workshop
- One-Day Options Course
- OptionsPro
- Retirement Income Workshop
- Sure-Fire Trading Systems (VectorVest, Inc.)
- Trading as a Business Workshop
- VectorVest 7 EOD
- VectorVest 7 RealTime/IntraDay
- VectorVest AutoTester
- VectorVest Educational Services
- VectorVest OnLine
- VectorVest Options Analyzer
- VectorVest ProGraphics v6.0
- VectorVest ProTrader 7
- VectorVest RealTime Derby Tool
- VectorVest Simulator
- VectorVest Variator
- VectorVest Watchdog
- StockCharts.com, Inc.
- Candle Patterns
- Candlestick Charting Explained
- Intermarket Technical Analysis
- John Murphy on Chart Analysis
- John Murphy's Chart Pattern Recognition
- John Murphy's Market Message
- MurphyExplainsMarketAnalysis-Intermarket Analysis
- MurphyExplainsMarketAnalysis-Visual Analysis
- StockCharts.com
- Technical Analysis of the Financial Markets
- The Visual Investor
