HOT TOPICS LIST
- MACD
- Fibonacci
- RSI
- Gann
- ADXR
- Stochastics
- Volume
- Triangles
- Futures
- Cycles
- Volatility
- ZIGZAG
- MESA
- Retracement
- Aroon
INDICATORS LIST
LIST OF TOPICS
PRINT THIS ARTICLE
by Jason Braswell
Sturm Ruger & Co., Inc. looked ready to break out of their long-term downtrend, but it now looks to have been a trap. Potential investors should now hold and see if the long-term trend will resume.
Position: Hold
Jason Braswell
Jason Braswell is the Director of Risk Management Services for Infinite Consulting, LLC. He attended graduate school for mathematics at the University of Florida in Gainesville and is an MTA affiliate.
PRINT THIS ARTICLE
TREND-CHANNEL
Ruger Breakout A Misfire
07/21/04 03:49:38 PMby Jason Braswell
Sturm Ruger & Co., Inc. looked ready to break out of their long-term downtrend, but it now looks to have been a trap. Potential investors should now hold and see if the long-term trend will resume.
Position: Hold
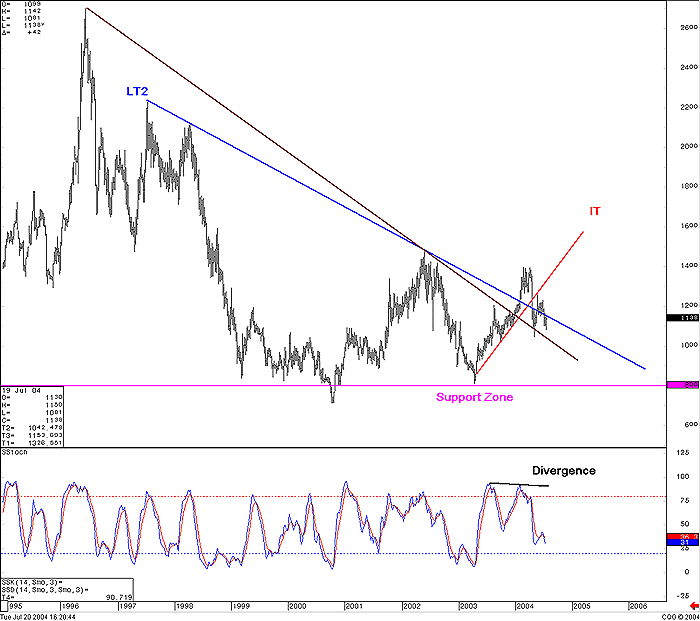
| Peaking at $27 back in 1996, the firearms manufacturer, Sturm Ruger & Co., Inc, has since been in a long-term downtrend, guided by trendlines LT1 and LT2. As you can see, along with a support zone in the $8.00 range, these trendlines looked to be the components of a huge descending triangle on the weekly chart. This pattern typically signals continuation but can also be a reversal sign, depending upon which way prices break out. |

|
| Figure 1: Ruger weekly chart. |
| Graphic provided by: CQG Net. |
| |
| Using this reasoning, an investor would have been encouraged to pick up some shares in early 2004, when prices broke through both of these long-term resistance lines, riding trendline IT to a high of $13.97, offering some hope that the long-term downtrend might be ready to reverse. However, anyone watching the stochastic oscillator during this rally would've noticed a slight bearish divergence that turned out to have warned of underlying weakness in the shorter-term trend. |
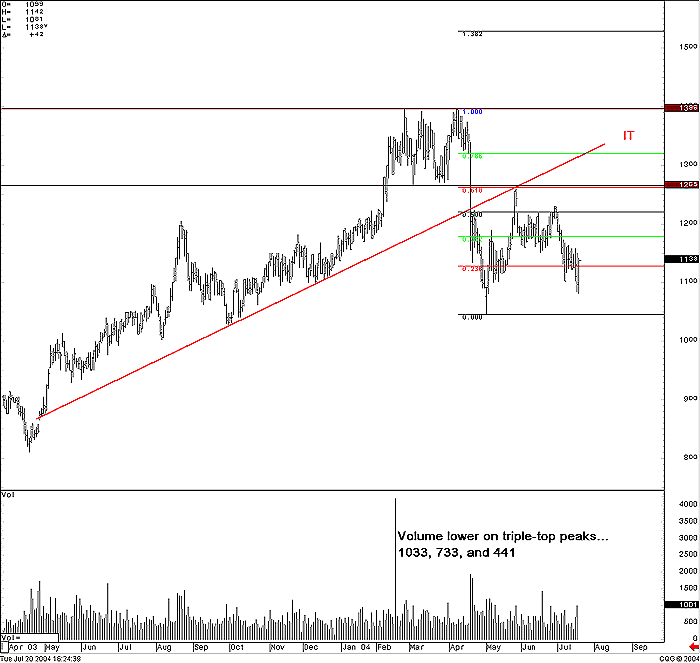
 Figure 2: Ruger daily chart. Turning our focus to the daily chart, the intermediate trend that appeared to hold the promise of a longer-term reversal has since fizzled out. From February to April 2004, the stock held in a trading range of $12.65 to $13.97, during which time it traced out a textbook triple top, with each top peaking on progressively lower volume. Price moved dramatically below support on April 20th, confirming the triple top pattern and settling below trendline IT. Since then, prices have pulled back to almost exactly the convergence of the 61.8% retracement of the bear move and the trendline IT, which is now acting as resistance. Furthermore, prices have since settled back under the flatter, long-term trendline LT2. Any remaining questions about the viability of the long-term downtrend will likely soon be answered, as the stock price is approaching long-term trendline LT1 from the topside, and a settlement below this line would invalidate all of the evidence one might have adduced for buying long-term on the breakout. |
| For now, the best strategy is to stay out and see how price plays out vis-a-vis these major trendlines and, most importantly, the $8.00 support zone. If this support zone holds, you could consider buying into this stock. Fundamentally, the company appears to be in good shape and consistently turns a profit; this long-term downtrend may be indicative of investors' general unwillingness to participate in the firearms industry amidst the political climate. Hence, such stocks may prove to be a good value for those willing to keep watch. |
Jason Braswell is the Director of Risk Management Services for Infinite Consulting, LLC. He attended graduate school for mathematics at the University of Florida in Gainesville and is an MTA affiliate.
| Company: | Infinite Consulting, LLC |
| Website: | www.infiniteconsulting.org |
| E-mail address: | jbraswell@infiniteconsulting.org |
Traders' Resource Links | |
| Infinite Consulting, LLC has not added any product or service information to TRADERS' RESOURCE. | |
Click here for more information about our publications!
Comments

Request Information From Our Sponsors
- StockCharts.com, Inc.
- Candle Patterns
- Candlestick Charting Explained
- Intermarket Technical Analysis
- John Murphy on Chart Analysis
- John Murphy's Chart Pattern Recognition
- John Murphy's Market Message
- MurphyExplainsMarketAnalysis-Intermarket Analysis
- MurphyExplainsMarketAnalysis-Visual Analysis
- StockCharts.com
- Technical Analysis of the Financial Markets
- The Visual Investor
- VectorVest, Inc.
- Executive Premier Workshop
- One-Day Options Course
- OptionsPro
- Retirement Income Workshop
- Sure-Fire Trading Systems (VectorVest, Inc.)
- Trading as a Business Workshop
- VectorVest 7 EOD
- VectorVest 7 RealTime/IntraDay
- VectorVest AutoTester
- VectorVest Educational Services
- VectorVest OnLine
- VectorVest Options Analyzer
- VectorVest ProGraphics v6.0
- VectorVest ProTrader 7
- VectorVest RealTime Derby Tool
- VectorVest Simulator
- VectorVest Variator
- VectorVest Watchdog
