HOT TOPICS LIST
- MACD
- Fibonacci
- RSI
- Gann
- ADXR
- Stochastics
- Volume
- Triangles
- Futures
- Cycles
- Volatility
- ZIGZAG
- MESA
- Retracement
- Aroon
INDICATORS LIST
LIST OF TOPICS
PRINT THIS ARTICLE
by Gary Grosschadl
The high tech Nasdaq Index is looking particularily weak at the moment. Downside targets are in sight.
Position: Sell
Gary Grosschadl
Independent Canadian equities trader and technical analyst based in Peterborough
Ontario, Canada.
PRINT THIS ARTICLE
CHART ANALYSIS
Nasdaq Downside Targets
07/20/04 09:23:08 AMby Gary Grosschadl
The high tech Nasdaq Index is looking particularily weak at the moment. Downside targets are in sight.
Position: Sell
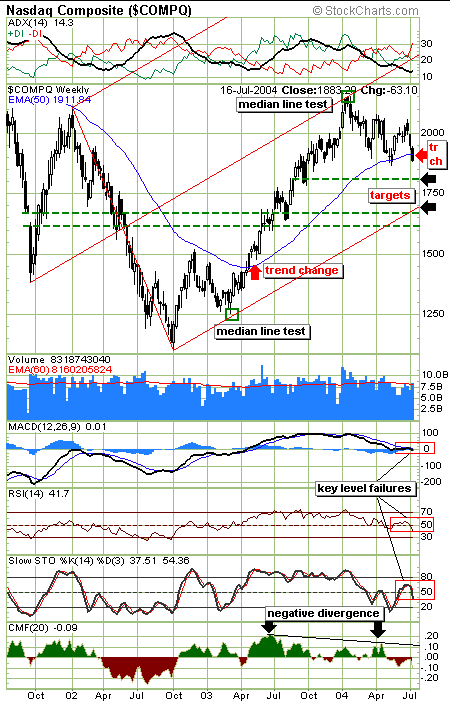
| In order to gain a broader perspective on the Nasdaq, I consulted a weekly chart. On it, I placed a large pitchfork or Andrews Line, based on three significant turning points (low, high, low) to anchor the pattern. A tenant of pitchfork theory is that a move off the lower median line has an 80% chance of reaching the median line or "tine" of the pitchfork, if the pattern is valid. The chart shows two tests of median lines being reached as labeled. Those traders that targeted the median line target were well rewarded in timing a healthy upleg followed by a timely exit point. |
| The ensuing downleg was halted at the 50-week exponential moving average, where it then enjoyed a mutli-week gain, eventually failing above the 2000 level. This reversal could prompt an eventual lower median line test. Note the importance of the 50-week moving average on this chart. After coming off the previous 1250 median line touch, the index managed to break overhead resistance at the moving average. As is now obvious, this was a major trend change. Now it seems that the same EMA is working in reverse. The last trading session resulted in the index breaking below the 50-week EMA. This is quite possibly announcing another trend change. |

|
| Weekly chart shows downside targets. |
| Graphic provided by: Stockcharts.com. |
| |
| If this is correct, then two downside targets are suggested. The first coincides with some significant previous candlestick points at 1800, and the second is in the 1700 range, this being the lower median line and an area of previous congestion. It also coincides with a gap area at the far left side of the chart. Previous gaps often offer future areas of support and resistance. In the bigger scheme of things, the large pitchfork remains bullish, provided that the lower median line holds support. The greater the number of trendline touches occurring in any pattern, the stronger the pattern conviction and pitchforks are no exception. |
| Several indicators below the chart also reflect the bearish sentiment of the index failing the 50-period EMA line. The MACD (moving average convergence/divergence) indicator is slipping under its zero line while the next two indicators have failed under their key 50 levels. The Chaiken money flow indicator at the very bottom shows a very significant negative divergence having occurred. While the index worked several hundred points higher, this supply/demand indicator refused to follow bullishly upwards. This suggests the bigger money players were either absent or had little faith of a sustainable rise. |
| A sudden reversal back above the 50-week EMA would alleviate bearish concerns but right now a lower test seems to be in the making. Watch for possible reversals at or near those suggested support areas. |
Independent Canadian equities trader and technical analyst based in Peterborough
Ontario, Canada.
| Website: | www.whatsonsale.ca/financial.html |
| E-mail address: | gwg7@sympatico.ca |
Click here for more information about our publications!
Comments
Date: 07/21/04Rank: 5Comment:
Date: 07/23/04Rank: Comment: When I annotate the pitchfork exactly the way you did with the exact same timefram the lower tine of pitchfork is at 1500. Why the huge discrepency?. I am using the exact same pivot points for the pitchfork.

Request Information From Our Sponsors
- StockCharts.com, Inc.
- Candle Patterns
- Candlestick Charting Explained
- Intermarket Technical Analysis
- John Murphy on Chart Analysis
- John Murphy's Chart Pattern Recognition
- John Murphy's Market Message
- MurphyExplainsMarketAnalysis-Intermarket Analysis
- MurphyExplainsMarketAnalysis-Visual Analysis
- StockCharts.com
- Technical Analysis of the Financial Markets
- The Visual Investor
- VectorVest, Inc.
- Executive Premier Workshop
- One-Day Options Course
- OptionsPro
- Retirement Income Workshop
- Sure-Fire Trading Systems (VectorVest, Inc.)
- Trading as a Business Workshop
- VectorVest 7 EOD
- VectorVest 7 RealTime/IntraDay
- VectorVest AutoTester
- VectorVest Educational Services
- VectorVest OnLine
- VectorVest Options Analyzer
- VectorVest ProGraphics v6.0
- VectorVest ProTrader 7
- VectorVest RealTime Derby Tool
- VectorVest Simulator
- VectorVest Variator
- VectorVest Watchdog
