HOT TOPICS LIST
- MACD
- Fibonacci
- RSI
- Gann
- ADXR
- Stochastics
- Volume
- Triangles
- Futures
- Cycles
- Volatility
- ZIGZAG
- MESA
- Retracement
- Aroon
INDICATORS LIST
LIST OF TOPICS
PRINT THIS ARTICLE
by David Penn
While some may have longed for a head and shoulders bottom, the July breakdowns in Best Buy add to the saga of retail's woes.
Position: N/A
David Penn
Technical Writer for Technical Analysis of STOCKS & COMMODITIES magazine, Working-Money.com, and Traders.com Advantage.
PRINT THIS ARTICLE
FALSE MOVES
Best Buy: The Bid Is A Lonely Hunter
07/21/04 11:53:16 AMby David Penn
While some may have longed for a head and shoulders bottom, the July breakdowns in Best Buy add to the saga of retail's woes.
Position: N/A
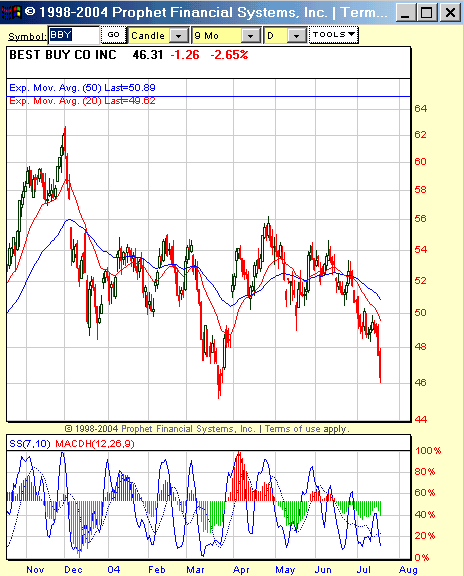
| As Best Buy rallied sharply in late March 2004, what bull could not have been forgiven for anticipating a major bull market in the stock going forward? With its relatively shallower previous trough in December 2003, and a higher trough three months later in March, I suspect not a few traders actually began to have visions of "head and shoulders bottoms" dancing in their heads. When Best Buy rallied above the consolidation high near 54.5 in late April, a $60 share price perhaps seemed not far off. |
| That, as they say, was then. In the time since Best Buy made an intraday high above 56, the stock has been hit with two sharp corrections. The first took shares back below 50 in mid-May. The second, and current, correction has seen Best Buy fall to as low as 46 in mid-July. |

|
| Figure 1: The "waterfall effect" takes shares of Best Buy over the edge and down toward a test of the March 2004 lows. |
| Graphic provided by: Prophet Financial Systems, Inc.. |
| |
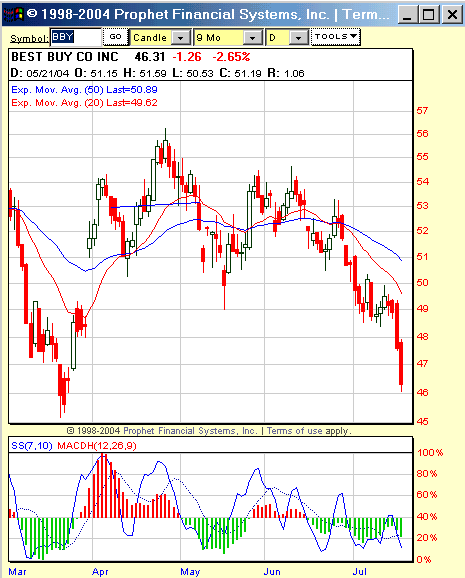
| More than a few market observers (Gary Kaltbaum of Investor's Edge, is one) had their eye on Best Buy over the past week or so, particularly as the combination of bad news out of the retail sector met with bad news from the semiconductor sector to form a perfect storm for companies like Best Buy (consider also the chart of Radio Shack [RSH], a similarly downtrodden technology retailer). Often, price action or fundamentals will alert a trader to a general opportunity to the long or short side. But what about a sign, a signal, that the time to strike has arrived? Try looking for a perfect storm of your own. For an example to the short side, the combination of a market rallying into resistance, making a lower high or (even better) a negative divergence during the rally, an overbought stochastic and a downshift in the MACDH is an offer even the most cautious, risk-averse trader could not refuse. Sounds like too much to ask? Let's see how Best Buy stacks up against these criteria. |
 Figure 2: In the six weeks from the beginning of June to mid-July, Best Buy offered traders at least three excellent risk/reward opportunities for trades to the short side. Picking up Best Buy in the late spring, the May lows most likely seemed like a pivot low for an advance out of the March lows. However, as BBY rallied into June, a negative divergence developed between the price peaks in late May and early-mid June and the stochastic oscillator. This was the first warning that the hoped-for bull market off the March lows might be in trouble. Some aggressive players might have gone short or bought puts in mid-June based on these developments. However, those who prefer not to short above potential support -- such as both 20- and 50-day exponential moving averages (!) -- would likely have waited for the late June break/gap down. Here, still under the "sell signal" of the negative divergence, the gap down on June 29th or the MACDH downshift on the previous day, would have served as entry signals. |
| Not enough opportunity for you? Well, there was still yet another entry signal in Best Buy for those bears looking to take advantage of a stock that was hastening its retreat. This signal came as Best Buy broke down from its mini-consolidation in the first half of July. The day of the break was significantly bearish, with BBY falling from just over 49 to just under 48. And the scale of this decline likely convinced some bears that the best picking was already had. Not so, as it turned out, with Best Buy spending the following day in full-scale sell mode, finishing down another point and a quarter. Among the many axioms attributed to him, Jesse Livermore's quip that a market is never too high to buy and never too low to sell is worth recalling in this context. While it is true that a trader arriving "late" to a market has increased his or her chances of becoming the "greatest fool" by buying the top tick or selling the bottom one, the trader well-equipped with sound risk management is often better off arriving "late" as opposed to not arriving at all. |
Technical Writer for Technical Analysis of STOCKS & COMMODITIES magazine, Working-Money.com, and Traders.com Advantage.
| Title: | Technical Writer |
| Company: | Technical Analysis, Inc. |
| Address: | 4757 California Avenue SW |
| Seattle, WA 98116 | |
| Phone # for sales: | 206 938 0570 |
| Fax: | 206 938 1307 |
| Website: | www.Traders.com |
| E-mail address: | DPenn@traders.com |
Traders' Resource Links | |
| Charting the Stock Market: The Wyckoff Method -- Books | |
| Working-Money.com -- Online Trading Services | |
| Traders.com Advantage -- Online Trading Services | |
| Technical Analysis of Stocks & Commodities -- Publications and Newsletters | |
| Working Money, at Working-Money.com -- Publications and Newsletters | |
| Traders.com Advantage -- Publications and Newsletters | |
| Professional Traders Starter Kit -- Software | |
Click here for more information about our publications!
PRINT THIS ARTICLE

Request Information From Our Sponsors
- StockCharts.com, Inc.
- Candle Patterns
- Candlestick Charting Explained
- Intermarket Technical Analysis
- John Murphy on Chart Analysis
- John Murphy's Chart Pattern Recognition
- John Murphy's Market Message
- MurphyExplainsMarketAnalysis-Intermarket Analysis
- MurphyExplainsMarketAnalysis-Visual Analysis
- StockCharts.com
- Technical Analysis of the Financial Markets
- The Visual Investor
- VectorVest, Inc.
- Executive Premier Workshop
- One-Day Options Course
- OptionsPro
- Retirement Income Workshop
- Sure-Fire Trading Systems (VectorVest, Inc.)
- Trading as a Business Workshop
- VectorVest 7 EOD
- VectorVest 7 RealTime/IntraDay
- VectorVest AutoTester
- VectorVest Educational Services
- VectorVest OnLine
- VectorVest Options Analyzer
- VectorVest ProGraphics v6.0
- VectorVest ProTrader 7
- VectorVest RealTime Derby Tool
- VectorVest Simulator
- VectorVest Variator
- VectorVest Watchdog
