

HOT TOPICS LIST
- MACD
- Fibonacci
- RSI
- Gann
- ADXR
- Stochastics
- Volume
- Triangles
- Futures
- Cycles
- Volatility
- ZIGZAG
- MESA
- Retracement
- Aroon
INDICATORS LIST
LIST OF TOPICS
PRINT THIS ARTICLE
by David Penn
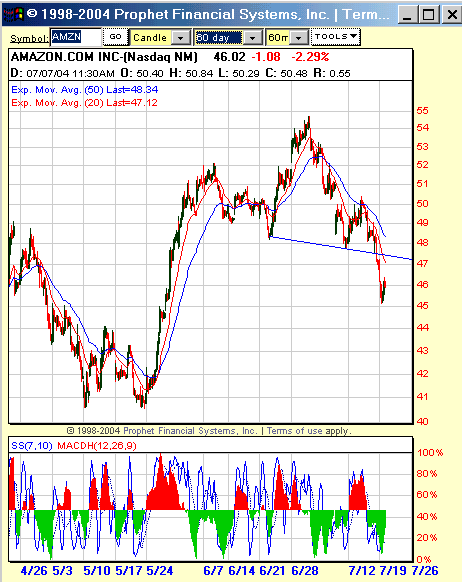
A head and shoulders top in the hourly chart of this internet stalwart suggests lower prices for Amazon in the near term.
Position: N/A
David Penn
Technical Writer for Technical Analysis of STOCKS & COMMODITIES magazine, Working-Money.com, and Traders.com Advantage.
PRINT THIS ARTICLE
HEAD & SHOULDERS
Amazon Shrugged
07/21/04 01:58:59 PMby David Penn
A head and shoulders top in the hourly chart of this internet stalwart suggests lower prices for Amazon in the near term.
Position: N/A
| Market commentator Jim Cramer has referred to Amazon.com as one of the "four horsemen" of the Internet (eBay and Yahoo are among the others, I believe). Anyone who lived, invested and/or traded through the late 1990s will recognize Amazon as one of the winners of the Internet boom, a boom that left more than a few e-casualities scattered across the cybersphere. During the bull market of the past year, Amazon was one of those generals from the last war that had come back -- MacArthur-like -- to lead another charge against pessimism, defeatism and stock market bearishness. |
| Since the May 2004 lows, Amazon has been in its own little mini bull market. From a low of about $41 in mid-to-late May, AMZN climbed to more than $54 by the end of June, nearly a 32% gain. |
|
| Further declines should be right around the corner as Amazon struggles to test a neckline that has turned from support into resistance. |
| Graphic provided by: Prophet Financial Systems, Inc.. |
| |
| However those eye-popping gains appear in danger of disintegration -- at least if the head and shoulders top shares of Amazon have slipped into has its way. Although lopsided and downwardly sloping, this bearish reversal/topping pattern has already resulted in a sharp price break in Amazon, with prices slipping beneath "neckline" support near 48 to as low as 45.25 before bouncing up barely over 46. |
| This reversal should not be a great surprise. While it is true that stocks -- particularly Nasdaq stocks -- have appeared to be slipping back into bear market mode, it is no less true that, even on its own merits, AMZN's nearly-straight up rally in late May augured an equally "straight" ride down as soon as enthusiasm for the stock subsided. |
| What sort of downside might Amazon have in store for shareholders (and short sellers!)? Given a formation size of about seven, and a neckline that is at about 47.5 when it is broken, traders and investors should be prepared for a significant decline, perhaps a decline to as low as 40 or 41 in an initial move down. |
Technical Writer for Technical Analysis of STOCKS & COMMODITIES magazine, Working-Money.com, and Traders.com Advantage.
| Title: | Technical Writer |
| Company: | Technical Analysis, Inc. |
| Address: | 4757 California Avenue SW |
| Seattle, WA 98116 | |
| Phone # for sales: | 206 938 0570 |
| Fax: | 206 938 1307 |
| Website: | www.Traders.com |
| E-mail address: | DPenn@traders.com |
Traders' Resource Links | |
| Charting the Stock Market: The Wyckoff Method -- Books | |
| Working-Money.com -- Online Trading Services | |
| Traders.com Advantage -- Online Trading Services | |
| Technical Analysis of Stocks & Commodities -- Publications and Newsletters | |
| Working Money, at Working-Money.com -- Publications and Newsletters | |
| Traders.com Advantage -- Publications and Newsletters | |
| Professional Traders Starter Kit -- Software | |
Click here for more information about our publications!
PRINT THIS ARTICLE

Request Information From Our Sponsors
- VectorVest, Inc.
- Executive Premier Workshop
- One-Day Options Course
- OptionsPro
- Retirement Income Workshop
- Sure-Fire Trading Systems (VectorVest, Inc.)
- Trading as a Business Workshop
- VectorVest 7 EOD
- VectorVest 7 RealTime/IntraDay
- VectorVest AutoTester
- VectorVest Educational Services
- VectorVest OnLine
- VectorVest Options Analyzer
- VectorVest ProGraphics v6.0
- VectorVest ProTrader 7
- VectorVest RealTime Derby Tool
- VectorVest Simulator
- VectorVest Variator
- VectorVest Watchdog
- StockCharts.com, Inc.
- Candle Patterns
- Candlestick Charting Explained
- Intermarket Technical Analysis
- John Murphy on Chart Analysis
- John Murphy's Chart Pattern Recognition
- John Murphy's Market Message
- MurphyExplainsMarketAnalysis-Intermarket Analysis
- MurphyExplainsMarketAnalysis-Visual Analysis
- StockCharts.com
- Technical Analysis of the Financial Markets
- The Visual Investor