HOT TOPICS LIST
- MACD
- Fibonacci
- RSI
- Gann
- ADXR
- Stochastics
- Volume
- Triangles
- Futures
- Cycles
- Volatility
- ZIGZAG
- MESA
- Retracement
- Aroon
INDICATORS LIST
LIST OF TOPICS
PRINT THIS ARTICLE
by Kevin Hopson
ChevronTexaco's diamond breakout and symmetrical triangle breakout both indicate higher prices in the near-term.
Position: Hold
Kevin Hopson
Kevin has been a technical analyst for roughly 10 years now. Previously, Kevin owned his own business and acted as a registered investment advisor, specializing in energy. He was also a freelance oil analyst for Orient Trading Co., a commodity futures trading firm in Japan. Kevin is currently a freelance writer.
PRINT THIS ARTICLE
TECHNICAL ANALYSIS
ChevronTexaco's Double Pattern Breakout
07/19/04 01:53:58 PMby Kevin Hopson
ChevronTexaco's diamond breakout and symmetrical triangle breakout both indicate higher prices in the near-term.
Position: Hold
| ChevronTexaco Corp. (CVX) - like most other integrated oil companies - has benefited from higher energy prices this year. This is evident in the year-to-date chart. However, given the sector's strength the last few years, some investors believe that oil prices (and related stocks) have peaked, leaving little upside potential. My strategy - regardless of what others say - is to go with the trend until the technicals prove otherwise. Though I continue to be bullish on the fundamental picture, my job is to analyze the technicals, and I will do just that for ChevronTexaco. |
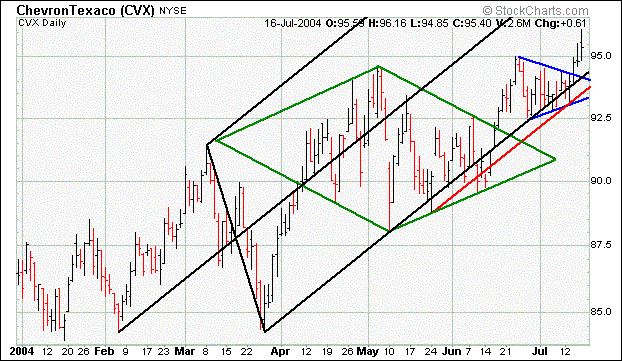
| For the most part ChevronTexaco has been contained within the rising black pitchfork, shown on the chart below, since late March. During this uptrend, a couple of interesting patterns developed. Notice the diamond pattern, as outlined by the green trendlines, that formed during the months of April, May and June. Diamond formations tend to act as reversal patterns but they can also act as continuation patterns. The latter was the case with ChevronTexaco, as the stock broke to the upside from this pattern in mid-June. |

|
| Graphic provided by: Stockcharts.com. |
| |
| A price target can be calculated by taking the width of the diamond (from high to low) and adding this to the point of breakout. The width of the diamond is roughly $6.50 ($94.50 - $88.00). If you add this to the breakout point ($92.00), you come up with a potential price target of $98.50 ($92.00 + $6.50). However, the stock recently broke out of a bullish symmetrical triangle as well. Like the diamond pattern, if you take the width of the triangle ($95.00 - $92.50 = $2.50) and add it to the point of breakout ($94.50), you can come up with a rough price target. In this case, the bullish triangle breakout indicates a potential move up to the $97.00 level ($94.50 + $2.50). Based on the two pattern breakouts, ChevronTexaco could eventually make its way up to the $97.00 to $98.50 range. Therefore, I would continue to hold until the technicals say otherwise. |
Kevin has been a technical analyst for roughly 10 years now. Previously, Kevin owned his own business and acted as a registered investment advisor, specializing in energy. He was also a freelance oil analyst for Orient Trading Co., a commodity futures trading firm in Japan. Kevin is currently a freelance writer.
| Glen Allen, VA | |
| E-mail address: | hopson_1@yahoo.com |
Click here for more information about our publications!
PRINT THIS ARTICLE

Request Information From Our Sponsors
- StockCharts.com, Inc.
- Candle Patterns
- Candlestick Charting Explained
- Intermarket Technical Analysis
- John Murphy on Chart Analysis
- John Murphy's Chart Pattern Recognition
- John Murphy's Market Message
- MurphyExplainsMarketAnalysis-Intermarket Analysis
- MurphyExplainsMarketAnalysis-Visual Analysis
- StockCharts.com
- Technical Analysis of the Financial Markets
- The Visual Investor
- VectorVest, Inc.
- Executive Premier Workshop
- One-Day Options Course
- OptionsPro
- Retirement Income Workshop
- Sure-Fire Trading Systems (VectorVest, Inc.)
- Trading as a Business Workshop
- VectorVest 7 EOD
- VectorVest 7 RealTime/IntraDay
- VectorVest AutoTester
- VectorVest Educational Services
- VectorVest OnLine
- VectorVest Options Analyzer
- VectorVest ProGraphics v6.0
- VectorVest ProTrader 7
- VectorVest RealTime Derby Tool
- VectorVest Simulator
- VectorVest Variator
- VectorVest Watchdog
