HOT TOPICS LIST
- MACD
- Fibonacci
- RSI
- Gann
- ADXR
- Stochastics
- Volume
- Triangles
- Futures
- Cycles
- Volatility
- ZIGZAG
- MESA
- Retracement
- Aroon
INDICATORS LIST
LIST OF TOPICS
PRINT THIS ARTICLE
by Gary Grosschadl
From 2002 to 2004, this Canadian oil giant has doubled in price from $35 to $70. Now it's off its peak.
Position: Sell
Gary Grosschadl
Independent Canadian equities trader and technical analyst based in Peterborough
Ontario, Canada.
PRINT THIS ARTICLE
TRITOP/TRI BOTTOM
Triangle Top Test For Petro-Canada
07/19/04 01:45:15 PMby Gary Grosschadl
From 2002 to 2004, this Canadian oil giant has doubled in price from $35 to $70. Now it's off its peak.
Position: Sell
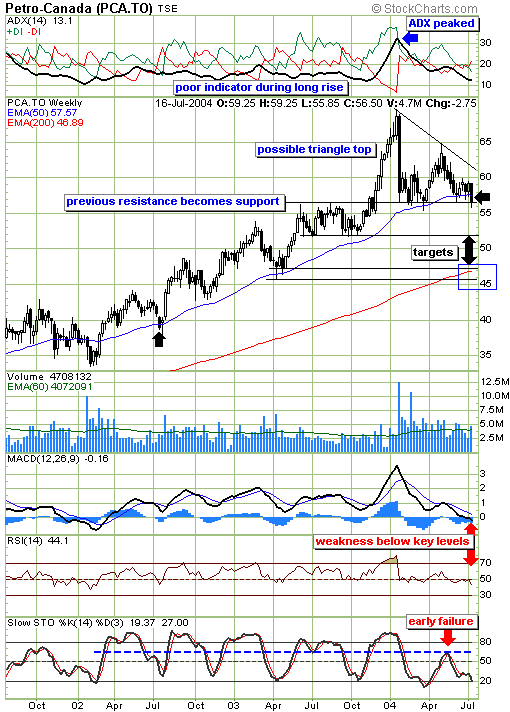
| This weekly chart for Petro-Canada (PCA.to) suggests that a triangle top may be in the making. After a long rise or fall, stocks often consolidate, carving out triangular top or bottom formations. The chart also is a reminder that a stock can fall quicker than it rises. Note the eight week rise past $56, followed by a much more dramatic one week decline in January. |
| I have an early sell bias here due to mitigating circumstances. A true pattern reader will wait for the bottom trendline to be broken with conviction. This line was briefly violated last week but recovered to close at this trendline. What are these mitagating circumstances? |

|
| Petro-Canada's weekly chart. |
| Graphic provided by: Stockcharts.com. |
| |
| A major moving average has been violated to the downside. The stock has closed under its 50-week exponential moving average for the first time in two years. This moving average has acted as a superb dynamic trendline of support during this long rise and now has just been violated. The other "mitigating circumstances" are seen in the following indicators. The MACD (moving averge convergence/divergence) has fallen below its key zero line, hinting at major weakness ahead. Likewise the RSI (relative strength index) has failed its key support at the 50 level. The stochastics indicator shows how the earliest stochastic upleg failure occurred in over two years. I believe this was a good sign of significant weakness ahead, already foreshadowed back in May. |
| A surprise move back up that beats the top triangle trendline would change my bearish mind but in the meantime I have two downside targets in mind. The first possible support line is a previous support level at about $52. Bigger suppport is offered by a confluence of resistance between $45 to $47. Note the previous hammer candlestick and the 200-period exponential moving average. |
| Finally, note that last week showed an expansion in volume. Perhaps other traders are also wary of possible weakness ahead. There is a strange divergence though, as oil prices have been surging lately and this bears watching. |
Independent Canadian equities trader and technical analyst based in Peterborough
Ontario, Canada.
| Website: | www.whatsonsale.ca/financial.html |
| E-mail address: | gwg7@sympatico.ca |
Click here for more information about our publications!
PRINT THIS ARTICLE

Request Information From Our Sponsors
- StockCharts.com, Inc.
- Candle Patterns
- Candlestick Charting Explained
- Intermarket Technical Analysis
- John Murphy on Chart Analysis
- John Murphy's Chart Pattern Recognition
- John Murphy's Market Message
- MurphyExplainsMarketAnalysis-Intermarket Analysis
- MurphyExplainsMarketAnalysis-Visual Analysis
- StockCharts.com
- Technical Analysis of the Financial Markets
- The Visual Investor
- VectorVest, Inc.
- Executive Premier Workshop
- One-Day Options Course
- OptionsPro
- Retirement Income Workshop
- Sure-Fire Trading Systems (VectorVest, Inc.)
- Trading as a Business Workshop
- VectorVest 7 EOD
- VectorVest 7 RealTime/IntraDay
- VectorVest AutoTester
- VectorVest Educational Services
- VectorVest OnLine
- VectorVest Options Analyzer
- VectorVest ProGraphics v6.0
- VectorVest ProTrader 7
- VectorVest RealTime Derby Tool
- VectorVest Simulator
- VectorVest Variator
- VectorVest Watchdog
