HOT TOPICS LIST
- MACD
- Fibonacci
- RSI
- Gann
- ADXR
- Stochastics
- Volume
- Triangles
- Futures
- Cycles
- Volatility
- ZIGZAG
- MESA
- Retracement
- Aroon
INDICATORS LIST
LIST OF TOPICS
PRINT THIS ARTICLE
by Jason Braswell
Natural gas just broke down out of a major pattern and looks ready to fall further, but key support is in the way. Can prices push through, or are they due for another bounce?
Position: Hold
Jason Braswell
Jason Braswell is the Director of Risk Management Services for Infinite Consulting, LLC. He attended graduate school for mathematics at the University of Florida in Gainesville and is an MTA affiliate.
PRINT THIS ARTICLE
TRIANGLES
Natural Gas Due For Another Bounce?
07/19/04 10:09:05 AMby Jason Braswell
Natural gas just broke down out of a major pattern and looks ready to fall further, but key support is in the way. Can prices push through, or are they due for another bounce?
Position: Hold
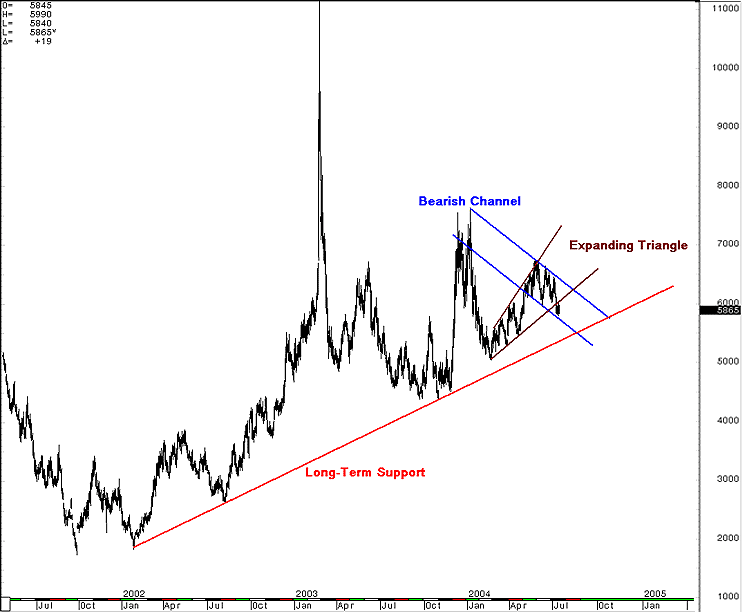
| Last time I looked at natural gas, I discussed several reasons why prices would likely break down out of the expanding triangle pattern evolving on the daily spot chart. Though prices flirted with a break of resistance as they made their $6.76 high, this luckily turned out to be noise, and the original prediction has since been vindicated. As you can see, prices broke out of the triangle and now look to be guided down in a bearish channel. How low will prices go in this downtrend? |

|
| Figure 1: Continuous Front Month. |
| Graphic provided by: CQG Net. |
| |
| Using the typical technique of measuring the width of the triangle at its widest point and projecting down from the breakout, I get a target of $6.00 - $1.20 = $4.80. However, such a projection might seem a bit optimistic, as major trendline support is currently sitting in the $5.45 - $5.55 range. |
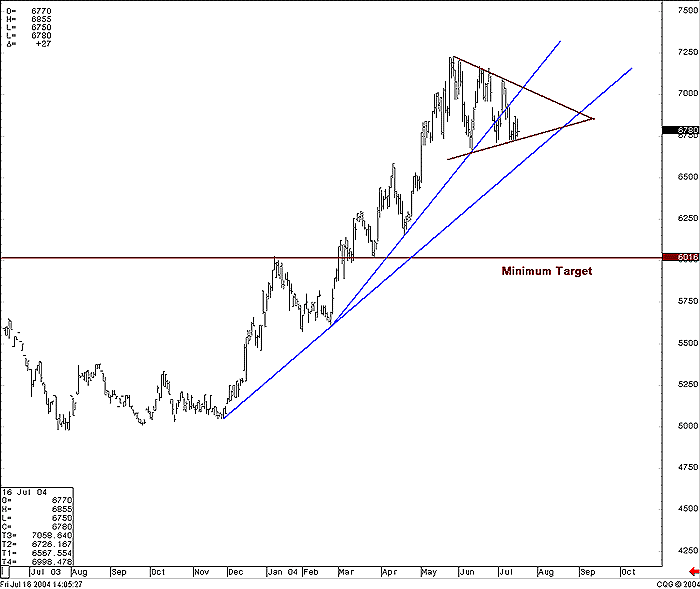
 Figure 2: January 2005 contracts. Though the situation merits caution, I'm biased toward prices breaking through this long-term support, perhaps fulfilling the expanding triangle's prophecy. Looking to the winter months, at the January 2005 contract for example, there are a number of interesting possible developments. First, after a strong rally, prices have settled into a symmetrical triangle, which, though it normally signals continuation, is often a reversal pattern. In this case, it's reasonable to favor the latter implication, given that it's also recently broken under an accelerated trendline that has etched out the uptrend. While the breach of the original, flatter trendline would offer better confirmation of a change in trend, the recent move still looks like a good sign for the bears. If January prices do break out of the bottom of the triangle, a minimum target for the move is right around $6.00, conveniently near a prior low. |
| Though I favor the bears over the next few months, watch the prices as they approach these key resistance/support areas on both charts, as the winter is already moving very much in concert with the spot month. Signs of a reversal would include the continuous chart pushing above channel resistance, as well as the January contract's settling above the resistance line forming the triangle. |
Jason Braswell is the Director of Risk Management Services for Infinite Consulting, LLC. He attended graduate school for mathematics at the University of Florida in Gainesville and is an MTA affiliate.
| Company: | Infinite Consulting, LLC |
| Website: | www.infiniteconsulting.org |
| E-mail address: | jbraswell@infiniteconsulting.org |
Traders' Resource Links | |
| Infinite Consulting, LLC has not added any product or service information to TRADERS' RESOURCE. | |
Click here for more information about our publications!
PRINT THIS ARTICLE

Request Information From Our Sponsors
- StockCharts.com, Inc.
- Candle Patterns
- Candlestick Charting Explained
- Intermarket Technical Analysis
- John Murphy on Chart Analysis
- John Murphy's Chart Pattern Recognition
- John Murphy's Market Message
- MurphyExplainsMarketAnalysis-Intermarket Analysis
- MurphyExplainsMarketAnalysis-Visual Analysis
- StockCharts.com
- Technical Analysis of the Financial Markets
- The Visual Investor
- VectorVest, Inc.
- Executive Premier Workshop
- One-Day Options Course
- OptionsPro
- Retirement Income Workshop
- Sure-Fire Trading Systems (VectorVest, Inc.)
- Trading as a Business Workshop
- VectorVest 7 EOD
- VectorVest 7 RealTime/IntraDay
- VectorVest AutoTester
- VectorVest Educational Services
- VectorVest OnLine
- VectorVest Options Analyzer
- VectorVest ProGraphics v6.0
- VectorVest ProTrader 7
- VectorVest RealTime Derby Tool
- VectorVest Simulator
- VectorVest Variator
- VectorVest Watchdog
