HOT TOPICS LIST
- MACD
- Fibonacci
- RSI
- Gann
- ADXR
- Stochastics
- Volume
- Triangles
- Futures
- Cycles
- Volatility
- ZIGZAG
- MESA
- Retracement
- Aroon
INDICATORS LIST
LIST OF TOPICS
PRINT THIS ARTICLE
by Kevin Hopson
Even though crude oil prices have been up and down this year, predicting the various cycles has been easier than you might think.
Position: Hold
Kevin Hopson
Kevin has been a technical analyst for roughly 10 years now. Previously, Kevin owned his own business and acted as a registered investment advisor, specializing in energy. He was also a freelance oil analyst for Orient Trading Co., a commodity futures trading firm in Japan. Kevin is currently a freelance writer.
PRINT THIS ARTICLE
TECHNICAL ANALYSIS
A Wild Six Months for Crude Oil
07/14/04 11:14:29 AMby Kevin Hopson
Even though crude oil prices have been up and down this year, predicting the various cycles has been easier than you might think.
Position: Hold
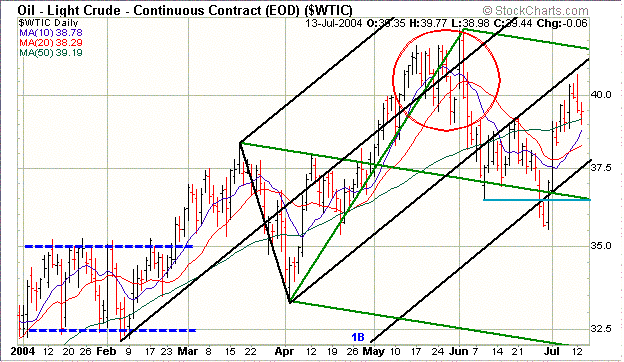
| Back in March, I said that crude oil prices were likely headed much higher given February's bullish trading range breakout. More specifically, I had an upside target of $42.50 to $45.00. As you can see in the year-to-date chart, crude oil prices reached the bottom of my target range to the exact cent ($42.50) before reversing. A confirming sign that this was likely a short-term top was the broadening (or expanding) triangle formation, as illustrated by the red circle. |
| A broadening triangle is a pattern of higher highs and lower lows. When you see this pattern develop, it is usually an indication of a forthcoming top. The primary reason being volatility. This type of action represents a fierce battle between bulls and bears. During this battle, those traders previously on the sidelines tend to get sucked into the market. When everyone is in, there is no one left to push prices higher. As a result, you usually see a pullback once a broadening formation is completed. |

|
| Graphic provided by: StockCharts.com. |
| |
| When crude oil prices started to sell-off, many eyes were on the $36.50 to $37.00 range. This was the site of the 61.8 percent retracement level from the April-June rally, the green median line, the 1A channel line and the previous June low (light blue line). When prices breached support here, it was a sign of further weakness. However, crude oil eventually reversed at $35.50 in late June. Though an illustration is not provided in the chart, there was a bullish divergence in the Moving Average Convergence/Divergence (MACD) indicator during this time. In other words, the MACD was putting in higher lows despite the fact that prices continued to decline. As a result, the break of support in the $36.50 to $37.00 range was a bear trap. |
| As you can see in the chart, crude oil has moved back above broken support levels and is now hovering around $40.00. If prices continue to rally, crude oil could make its way up to the $41.50 level in the near-term. This is the site of the top green parallel line and the bottom parallel line of the black pitchfork, which are both converging around $41.50. In the meantime, I would continue to hold. Just remember to strap on your boots because the crude oil market can take you on a wild ride. |
Kevin has been a technical analyst for roughly 10 years now. Previously, Kevin owned his own business and acted as a registered investment advisor, specializing in energy. He was also a freelance oil analyst for Orient Trading Co., a commodity futures trading firm in Japan. Kevin is currently a freelance writer.
| Glen Allen, VA | |
| E-mail address: | hopson_1@yahoo.com |
Click here for more information about our publications!
Comments

Request Information From Our Sponsors
- StockCharts.com, Inc.
- Candle Patterns
- Candlestick Charting Explained
- Intermarket Technical Analysis
- John Murphy on Chart Analysis
- John Murphy's Chart Pattern Recognition
- John Murphy's Market Message
- MurphyExplainsMarketAnalysis-Intermarket Analysis
- MurphyExplainsMarketAnalysis-Visual Analysis
- StockCharts.com
- Technical Analysis of the Financial Markets
- The Visual Investor
- VectorVest, Inc.
- Executive Premier Workshop
- One-Day Options Course
- OptionsPro
- Retirement Income Workshop
- Sure-Fire Trading Systems (VectorVest, Inc.)
- Trading as a Business Workshop
- VectorVest 7 EOD
- VectorVest 7 RealTime/IntraDay
- VectorVest AutoTester
- VectorVest Educational Services
- VectorVest OnLine
- VectorVest Options Analyzer
- VectorVest ProGraphics v6.0
- VectorVest ProTrader 7
- VectorVest RealTime Derby Tool
- VectorVest Simulator
- VectorVest Variator
- VectorVest Watchdog
