HOT TOPICS LIST
- MACD
- Fibonacci
- RSI
- Gann
- ADXR
- Stochastics
- Volume
- Triangles
- Futures
- Cycles
- Volatility
- ZIGZAG
- MESA
- Retracement
- Aroon
INDICATORS LIST
LIST OF TOPICS
PRINT THIS ARTICLE
by David Penn
Lower now than during the bull market peak in 2000, is this what bull markets are made of?
Position: N/A
David Penn
Technical Writer for Technical Analysis of STOCKS & COMMODITIES magazine, Working-Money.com, and Traders.com Advantage.
PRINT THIS ARTICLE
VOLATILITY
The Volatility Index: How Low Can it Go?
07/14/04 01:12:10 PMby David Penn
Lower now than during the bull market peak in 2000, is this what bull markets are made of?
Position: N/A
| One of the more common fashions in finance is to insist that models and methods that had proven effective over the years are "no longer operable" when the extremes of these models and methods are tested by real events. During the stock market bubble in 2000, long established measurements such as profitability were tossed aside in exchange for concepts as addle-minded as "eyeballs" and "mouse clicks". Such is the stuff that fuels the late end of bull markets: when the engine and transmission are almost completely shot, a fancy new coat of paint will make even a jalopy attractive--for a moment. |
| Apparently, it is now the Chicago Board of Options Exchange's Volatility Index that is taking its turn in the dustbin of financial history. As the volatility index or $VIX has fallen to lows surpassing those made during the market top in 2000, it has been increasingly common to suggest that the extremely low levels in the $VIX are proof positive that the volatility index is no longer operable. |

|
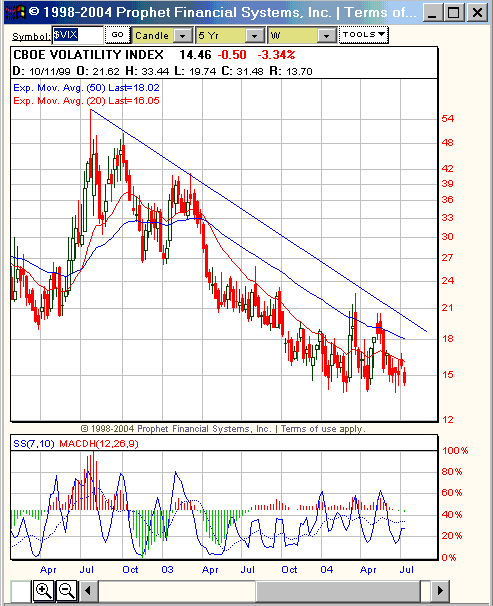
| Does the $VIX consolidation in early 2004 suggest a looming breakout in the second half of the year? |
| Graphic provided by: Prophet Financial Systems, Inc. |
| |
| "Too many people know about it" is one popular refrain--invoking some bastard version of the Heisenberg Principle as an explanation of last resort. Never mind that the $VIX is not some Magic Eight ball. If people are buying puts, the $VIX will note that. When people are buying calls, the $VIX will note that, as well. While it is true that indicators and oscillators will not always perform as expected, it is just as likely as the fault lies with the expectation as with the method or measurement. |
| This is particularly so when the beneficiary is the one making the claim that the tried and true must be abandoned in favor of the New Reality--that just happens to enrich them. Rarely, when the $VIX for example, is screaming higher, do we hear cries that the $VIX no longer works. But when bears complain that "complacency" has gotten out of control, the bulls have been quick of late to say, "Yeah, but the $VIX is still moving lower. You can't count on that. Look at what it's done for you bears LATELY." And that's a hard argument to fight. The $VIX has remained in this low-level, 18-16 range since October 2003 and those traders who have been banking on a $VIX bounce have been left waiting as the index scuttled along what they hope is a bottom. There has been a growing positive divergence between the $VIX and the stochastic indicator, but as traders have been reminded by the recent action in the $SPX (see my "Denying the Divergence", June 29, 2004, Traders.com Advantage), such divergences can continue for some time... even when they are ultimately validated by a break in the direction suggested by the divergence. |
| But I can't help but be struck by the behavior of the MACDH, which stopped making deep troughs back in the spring of 2003. Since that time, spikes to the upside in MACDH have been also quite limited. But the near disappearance of negative MACDH bars suggests that the lows might be getting nearer and nearer. Right now, a move in the $VIX above 16.75 would be bullish for volatility going forward. Conversely, traders should watch to see whether or not a new low in the $VIX takes place below about 13.75. |
Technical Writer for Technical Analysis of STOCKS & COMMODITIES magazine, Working-Money.com, and Traders.com Advantage.
| Title: | Technical Writer |
| Company: | Technical Analysis, Inc. |
| Address: | 4757 California Avenue SW |
| Seattle, WA 98116 | |
| Phone # for sales: | 206 938 0570 |
| Fax: | 206 938 1307 |
| Website: | www.Traders.com |
| E-mail address: | DPenn@traders.com |
Traders' Resource Links | |
| Charting the Stock Market: The Wyckoff Method -- Books | |
| Working-Money.com -- Online Trading Services | |
| Traders.com Advantage -- Online Trading Services | |
| Technical Analysis of Stocks & Commodities -- Publications and Newsletters | |
| Working Money, at Working-Money.com -- Publications and Newsletters | |
| Traders.com Advantage -- Publications and Newsletters | |
| Professional Traders Starter Kit -- Software | |
Click here for more information about our publications!
Comments
Date: 07/14/04Rank: 5Comment:
Date: 07/19/04Rank: 4Comment:
Date: 07/20/04Rank: 4Comment:

|

Request Information From Our Sponsors
- StockCharts.com, Inc.
- Candle Patterns
- Candlestick Charting Explained
- Intermarket Technical Analysis
- John Murphy on Chart Analysis
- John Murphy's Chart Pattern Recognition
- John Murphy's Market Message
- MurphyExplainsMarketAnalysis-Intermarket Analysis
- MurphyExplainsMarketAnalysis-Visual Analysis
- StockCharts.com
- Technical Analysis of the Financial Markets
- The Visual Investor
- VectorVest, Inc.
- Executive Premier Workshop
- One-Day Options Course
- OptionsPro
- Retirement Income Workshop
- Sure-Fire Trading Systems (VectorVest, Inc.)
- Trading as a Business Workshop
- VectorVest 7 EOD
- VectorVest 7 RealTime/IntraDay
- VectorVest AutoTester
- VectorVest Educational Services
- VectorVest OnLine
- VectorVest Options Analyzer
- VectorVest ProGraphics v6.0
- VectorVest ProTrader 7
- VectorVest RealTime Derby Tool
- VectorVest Simulator
- VectorVest Variator
- VectorVest Watchdog
