HOT TOPICS LIST
- MACD
- Fibonacci
- RSI
- Gann
- ADXR
- Stochastics
- Volume
- Triangles
- Futures
- Cycles
- Volatility
- ZIGZAG
- MESA
- Retracement
- Aroon
INDICATORS LIST
LIST OF TOPICS
PRINT THIS ARTICLE
by David Penn
Lower long rates look likely in the short term. But after that, a run up to 5.6% or higher might be what the market is gearing up for.
Position: N/A
David Penn
Technical Writer for Technical Analysis of STOCKS & COMMODITIES magazine, Working-Money.com, and Traders.com Advantage.
PRINT THIS ARTICLE
THE DIAMOND
The Ten-year Treasury Yield's Diamond Bottom
07/12/04 04:18:59 PMby David Penn
Lower long rates look likely in the short term. But after that, a run up to 5.6% or higher might be what the market is gearing up for.
Position: N/A
| Rates, rates, rates...With the Federal Reserve finally raising the cash rate at the end of June, the talk about interest rates has only continued to fill the word balloons of the financial commentariat. Are higher rates "better" --or even "bullish", as the ever-"optimistic" economist Larry Kudlow has insisted -- for stocks? Or, as the Lower Rate Critics are quick to insist, is it that "too low" rates for "too long" are the financial equivalent of a speedball, that nightmarish one-two punch of heroin and cocaine that alternately soothes and stimulates until there is little left to be soothed or stimulated? |
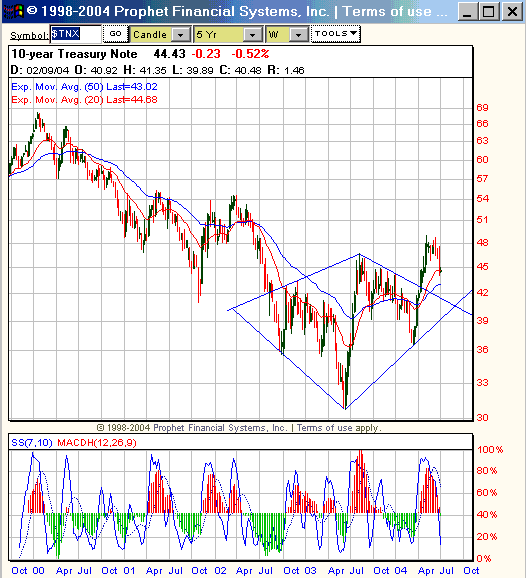
| I don't know or understand a great deal about the cash rate. But there have been interesting behaviors and patterns in the 10-year rate or, more accurately, in the yield on the ten-year Treasury note -- most notably, a pullback from a breakout in a sizable diamond pattern -- a pullback which could set the stage for a significant spike in 10-year rates. |

|
| If the breakout from this diamond pattern holds, $TNX could reach as high as 57 or 58 (i.e., 5.7% to 5.8%) in a resumption of the uptrend. |
| Graphic provided by: Prophet Financial Services, Inc.. |
| |
| The dominant technical pattern in the $TNX is the diamond bottom that developed from the declines during the summer of 2002 until the breakout in the spring of 2004. |
| I haven't read too much discussion of this diamond bottom, a bottom which marked the end of decades of falling long-term interest rates (long-term in this instance being ten years). But it will be interesting to watch as the $TNX drops down toward a potential support level on the upper right-hand side of the pattern. Actually, with regard to the integrity of the diamond bottom, the downwardly sloping upper right-hand side trendline is a key support level against which $TNX should bounce and begin to move higher. |
| How much higher? The dimensions of the diamond bottom have a pattern top at 4.668 and a pattern bottom at 3.074 for a formation size of 1.594. Adding this latter amount to the value at the breakout -- which appears to be approximately 4.2 -- gives an upside projection between 57 and 58, taking out the 2001 highs just above 54. |
Technical Writer for Technical Analysis of STOCKS & COMMODITIES magazine, Working-Money.com, and Traders.com Advantage.
| Title: | Technical Writer |
| Company: | Technical Analysis, Inc. |
| Address: | 4757 California Avenue SW |
| Seattle, WA 98116 | |
| Phone # for sales: | 206 938 0570 |
| Fax: | 206 938 1307 |
| Website: | www.Traders.com |
| E-mail address: | DPenn@traders.com |
Traders' Resource Links | |
| Charting the Stock Market: The Wyckoff Method -- Books | |
| Working-Money.com -- Online Trading Services | |
| Traders.com Advantage -- Online Trading Services | |
| Technical Analysis of Stocks & Commodities -- Publications and Newsletters | |
| Working Money, at Working-Money.com -- Publications and Newsletters | |
| Traders.com Advantage -- Publications and Newsletters | |
| Professional Traders Starter Kit -- Software | |
Click here for more information about our publications!
Comments
Date: 07/12/04Rank: 5Comment:
Date: 07/13/04Rank: 5Comment:

Request Information From Our Sponsors
- StockCharts.com, Inc.
- Candle Patterns
- Candlestick Charting Explained
- Intermarket Technical Analysis
- John Murphy on Chart Analysis
- John Murphy's Chart Pattern Recognition
- John Murphy's Market Message
- MurphyExplainsMarketAnalysis-Intermarket Analysis
- MurphyExplainsMarketAnalysis-Visual Analysis
- StockCharts.com
- Technical Analysis of the Financial Markets
- The Visual Investor
- VectorVest, Inc.
- Executive Premier Workshop
- One-Day Options Course
- OptionsPro
- Retirement Income Workshop
- Sure-Fire Trading Systems (VectorVest, Inc.)
- Trading as a Business Workshop
- VectorVest 7 EOD
- VectorVest 7 RealTime/IntraDay
- VectorVest AutoTester
- VectorVest Educational Services
- VectorVest OnLine
- VectorVest Options Analyzer
- VectorVest ProGraphics v6.0
- VectorVest ProTrader 7
- VectorVest RealTime Derby Tool
- VectorVest Simulator
- VectorVest Variator
- VectorVest Watchdog
