HOT TOPICS LIST
- MACD
- Fibonacci
- RSI
- Gann
- ADXR
- Stochastics
- Volume
- Triangles
- Futures
- Cycles
- Volatility
- ZIGZAG
- MESA
- Retracement
- Aroon
INDICATORS LIST
LIST OF TOPICS
PRINT THIS ARTICLE
by Koos van der Merwe
With the gold price jumping $10 in a day and breaking above the $400 mark once again, how do I see the metals and mining market?
Position: Accumulate
Koos van der Merwe
Has been a technical analyst since 1969, and has worked as a futures and options trader with First Financial Futures in Johannesburg, South Africa.
PRINT THIS ARTICLE
ELLIOTT WAVE
Metals & Mining: Whither Goest Thou?
07/09/04 12:30:45 PMby Koos van der Merwe
With the gold price jumping $10 in a day and breaking above the $400 mark once again, how do I see the metals and mining market?
Position: Accumulate
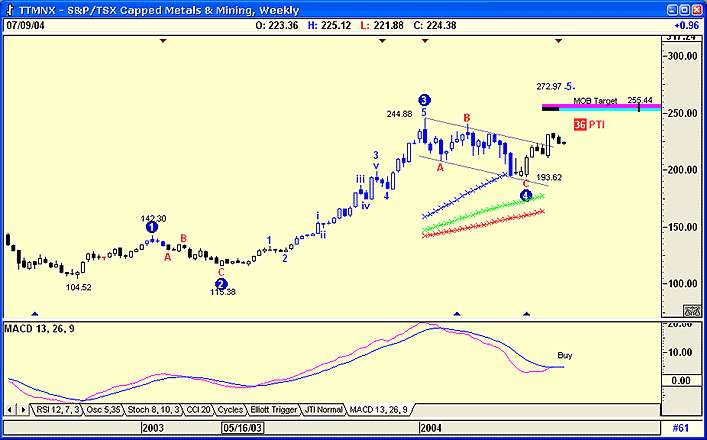
| Figure 1 is a weekly chart of the Metals and Mining index on the Toronto Stock exchange. The Elliott wave count shown was generated by the Advanced GET program, and it looks accurate. The fourth wave has formed a flag. The index has already broken above the upper flag boundary, and is on its way to test the MOB target of 255. 44. A MOB (Make or Break) study is an Advance GET tool that can help find a possible target price area for the end of an Elliott Wave 5, or for any pattern that has an impulse-correction-impulse pattern. |
| Elliott wave theory suggests that a fifth wave estimate is the length of wave 1 added to the wave 4 low. The chart shows that the length of wave 1 is 37.38 (142.30 - 104.52) added to 193.62 = 231.40. The MOB estimate for a fifth wave top is 255.44. This is a 1.618% calculation of Wave 1 added to the low of wave 4. The PTI of 36 is a probability factor. As long as the indicator is above 32, the chances of reaching the targeted fifth wave of 272.97 as shown on the chart is possible. We now have two targets that look feasible: 255.44 for the conservative, and 272.97. |

|
| Figure 1: The Toronto Stock Exchange Metals and Mining Index. |
| Graphic provided by: AdvancedGET. |
| |
| The chart also shows three lines below the fourth wave colored blue, green and red. The theory is that because wave 4 completed above the blue line, the chances of a strong wave 5 are there. Had the fourth wave turned at the red line, the fifth wave could be a "flat." A wave 5 is usually equal or greater in magnitude to wave 1. When it is less than wave 1 in length, it is regarded as a '"flat," a wave 5 that is simply not there and could in fact not exceed, or very slightly exceed the top of wave 3. Finally the MACD indicator suggests a buy signal. |
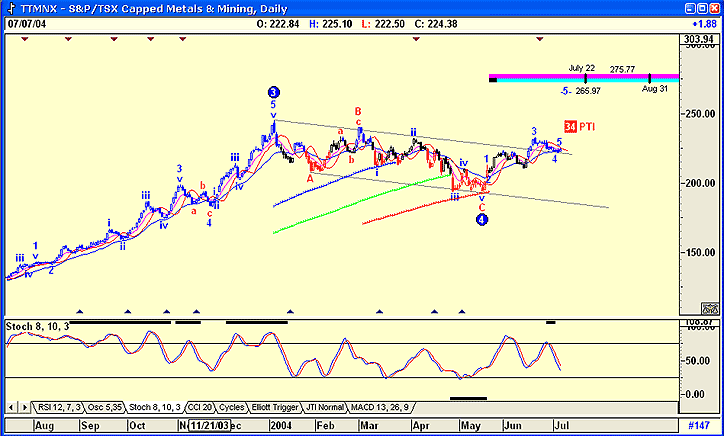
 Figure 2: S&P TSX daily chart. Looking at a daily chart to fine tune the index, note the following. 1. The wave count is still there, and the chart shows that the index is tracing a fourth wave. However the chart shows that the index has broken below the red line of the fourth wave, suggesting that the fifth wave could be a flat. 2. The PTI indicator is 34, less that the 36 of the weekly chart, suggesting that a flat for the fifth wave is very possible. 3. The program has calculated a fifth wave target of 265.97, less than the weekly calculation of 272.97. 4. The MOB target is 275.77, higher than the weekly MOB target of 255.44. 5. The chart also shows that the index has broken out of the flag pattern, and is using the upper trendline as a support level. 6. Finally, the stochastic I have used is suggesting further weakness for the short-term, in spite of a strong gold price. |
| To conclude, the index suggests that there is strength in the Metals and Minerals index, but not as strong as hoped for. You can purchase selective shares on the dips, but do place tight stops. |
Has been a technical analyst since 1969, and has worked as a futures and options trader with First Financial Futures in Johannesburg, South Africa.
| Address: | 3256 West 24th Ave |
| Vancouver, BC | |
| Phone # for sales: | 6042634214 |
| E-mail address: | petroosp@gmail.com |
Click here for more information about our publications!
Comments
Date: 07/13/04Rank: 4Comment:

Request Information From Our Sponsors
- StockCharts.com, Inc.
- Candle Patterns
- Candlestick Charting Explained
- Intermarket Technical Analysis
- John Murphy on Chart Analysis
- John Murphy's Chart Pattern Recognition
- John Murphy's Market Message
- MurphyExplainsMarketAnalysis-Intermarket Analysis
- MurphyExplainsMarketAnalysis-Visual Analysis
- StockCharts.com
- Technical Analysis of the Financial Markets
- The Visual Investor
- VectorVest, Inc.
- Executive Premier Workshop
- One-Day Options Course
- OptionsPro
- Retirement Income Workshop
- Sure-Fire Trading Systems (VectorVest, Inc.)
- Trading as a Business Workshop
- VectorVest 7 EOD
- VectorVest 7 RealTime/IntraDay
- VectorVest AutoTester
- VectorVest Educational Services
- VectorVest OnLine
- VectorVest Options Analyzer
- VectorVest ProGraphics v6.0
- VectorVest ProTrader 7
- VectorVest RealTime Derby Tool
- VectorVest Simulator
- VectorVest Variator
- VectorVest Watchdog
