HOT TOPICS LIST
- MACD
- Fibonacci
- RSI
- Gann
- ADXR
- Stochastics
- Volume
- Triangles
- Futures
- Cycles
- Volatility
- ZIGZAG
- MESA
- Retracement
- Aroon
INDICATORS LIST
LIST OF TOPICS
PRINT THIS ARTICLE
by Kevin Hopson
Archer Daniels Midland Co. has been stuck in a 5-month trading range but converging trendlines could foretell an important move soon.
Position: Hold
Kevin Hopson
Kevin has been a technical analyst for roughly 10 years now. Previously, Kevin owned his own business and acted as a registered investment advisor, specializing in energy. He was also a freelance oil analyst for Orient Trading Co., a commodity futures trading firm in Japan. Kevin is currently a freelance writer.
PRINT THIS ARTICLE
TECHNICAL ANALYSIS
A Trading Range For Archer Daniels Midland Co.
07/06/04 08:24:59 AMby Kevin Hopson
Archer Daniels Midland Co. has been stuck in a 5-month trading range but converging trendlines could foretell an important move soon.
Position: Hold
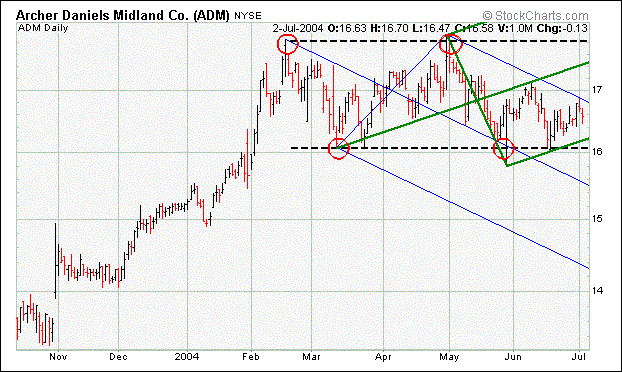
| Though the long-term trend is positive for Archer Daniels Midland Co. (ADM), the stock has been stuck in a trading range between $16.10 and $17.80 since mid-February. Because trading ranges tend to be continuation patterns and the trend is up, it would be expected to break to the upside. If so, the stock could eventually make its way up to the $21.00 to $23.00 range. This assumes that the stock will test the top channel line again and proceed to break out from there. For details on how to calculate price targets, please see my prior articles on trading ranges. |
| However, it is never safe to assume anything, especially when it comes to the market. Often your best bet is to wait things out. If the stock can make a decisive move above the $17.80 level, it would be a signal to go long. In the meantime, there are some interesting developments on the daily chart, which could help determine which way the stock eventually moves. For example, notice how the stock has been contained within the top half of the blue pitchfork and the bottom half of the green pitchfork recently. Since the bottom green parallel line ($16.20) and top blue parallel line ($16.80) are both converging upon one another, something will have to give soon. |

|
| Graphic provided by: Stockcharts.com. |
| |
| A move above the top blue parallel line would likely pave the way for a test of the green median line, in the $17.50 area. Also note, there is a massive amount of call open interest (over 17,000 contracts) at the $17.50 strike price. This means there will be significant selling pressure around the $17.50 level, as call sellers try to the keep the contracts out-of-the-money. On the other hand, a breach of support along the bottom green parallel line could lead to a test of the lower channel line and an eventual breakdown. If so, the blue median line would be a potential downside target in the near-term. Given all the possibilities, I would keep a close eye on these short-term price levels, as well as the bigger trading range picture. |
Kevin has been a technical analyst for roughly 10 years now. Previously, Kevin owned his own business and acted as a registered investment advisor, specializing in energy. He was also a freelance oil analyst for Orient Trading Co., a commodity futures trading firm in Japan. Kevin is currently a freelance writer.
| Glen Allen, VA | |
| E-mail address: | hopson_1@yahoo.com |
Click here for more information about our publications!
Comments
Date: 07/09/04Rank: 5Comment:

Request Information From Our Sponsors
- StockCharts.com, Inc.
- Candle Patterns
- Candlestick Charting Explained
- Intermarket Technical Analysis
- John Murphy on Chart Analysis
- John Murphy's Chart Pattern Recognition
- John Murphy's Market Message
- MurphyExplainsMarketAnalysis-Intermarket Analysis
- MurphyExplainsMarketAnalysis-Visual Analysis
- StockCharts.com
- Technical Analysis of the Financial Markets
- The Visual Investor
- VectorVest, Inc.
- Executive Premier Workshop
- One-Day Options Course
- OptionsPro
- Retirement Income Workshop
- Sure-Fire Trading Systems (VectorVest, Inc.)
- Trading as a Business Workshop
- VectorVest 7 EOD
- VectorVest 7 RealTime/IntraDay
- VectorVest AutoTester
- VectorVest Educational Services
- VectorVest OnLine
- VectorVest Options Analyzer
- VectorVest ProGraphics v6.0
- VectorVest ProTrader 7
- VectorVest RealTime Derby Tool
- VectorVest Simulator
- VectorVest Variator
- VectorVest Watchdog
