HOT TOPICS LIST
- MACD
- Fibonacci
- RSI
- Gann
- ADXR
- Stochastics
- Volume
- Triangles
- Futures
- Cycles
- Volatility
- ZIGZAG
- MESA
- Retracement
- Aroon
INDICATORS LIST
LIST OF TOPICS
PRINT THIS ARTICLE
by Gary Grosschadl
It's a good habit to occasionally stand back and take in the longer term picture of the market place.
Position: Hold
Gary Grosschadl
Independent Canadian equities trader and technical analyst based in Peterborough
Ontario, Canada.
PRINT THIS ARTICLE
CHART ANALYSIS
A Monthly Look At The S&P 500 Index
07/02/04 07:57:43 AMby Gary Grosschadl
It's a good habit to occasionally stand back and take in the longer term picture of the market place.
Position: Hold
| Many traders have a shorter term focus these days. But even short-term traders can benefit from taking in a longer term view to gain greater market insight. When the short or intermediate term outlook is confusing or unclear, a long-term view may help to gain needed perspective. |
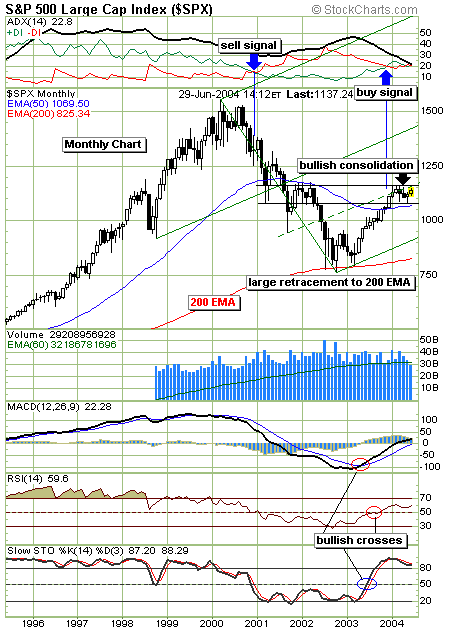
| This long-term monthly chart reminds us what a nasty haircut the overall markets have endured since 2000. Since the market meltdown began, the SPX shed 50 percent of its value at its low point near 750. Note that this major index corrected all the way down to the 200-period exponential moving average. In the past year this chart reflects the healthy rise off the previous lows. Now we witness a healthy consolidation above the 50-period EMA line, hinting at more bullish upside. A large pitchfork (Andrews Line) has been added to show the bullish stance. From this view it can be surmised that as long as the index stays above the lower median line, the bull trend is intact. Large pitchfork patterns often provide support and resistance levels at midpoint areas between forks and this may be the case here as a consolidation occured at that mid-level. |

|
| Bullish consolidation in the monthly S&P 500. |
| Graphic provided by: Stockcharts.com. |
| |
| Several indicators are worth mentioning. At the top of the chart, the directional movement indicator (DMI), showed a distinct sell signal as the DIs crossed. At about the same time, the relative strength index (RSI) slipped below its often critical level of 50, reaffirming that the bears had firm control. Several months ago these two indicators flashed respective buy signals when the RSI rose once again above the 50 level and the DIs bullishly crossed on the DMI indicator. Note the earlier signals from the bullish cross on the MACD (moving average convergence/divergence) indicator and the stochastics finally rising above the 50 level. In hindsight the clearest looking buy signal came from the MACD. |
| The next important move on this chart will probably come from the break of the rectangular consolidation pattern. If a large move ensues either way, the "outer" pitchfork lines are likely solid targets, in the realm of 1450 or 950. Let's revisit this premise in 8 to 10 months! |
Independent Canadian equities trader and technical analyst based in Peterborough
Ontario, Canada.
| Website: | www.whatsonsale.ca/financial.html |
| E-mail address: | gwg7@sympatico.ca |
Click here for more information about our publications!
Comments
Date: 07/07/04Rank: 5Comment:
Date: 07/07/04Rank: 4Comment:
Date: 07/13/04Rank: 5Comment:

Request Information From Our Sponsors
- StockCharts.com, Inc.
- Candle Patterns
- Candlestick Charting Explained
- Intermarket Technical Analysis
- John Murphy on Chart Analysis
- John Murphy's Chart Pattern Recognition
- John Murphy's Market Message
- MurphyExplainsMarketAnalysis-Intermarket Analysis
- MurphyExplainsMarketAnalysis-Visual Analysis
- StockCharts.com
- Technical Analysis of the Financial Markets
- The Visual Investor
- VectorVest, Inc.
- Executive Premier Workshop
- One-Day Options Course
- OptionsPro
- Retirement Income Workshop
- Sure-Fire Trading Systems (VectorVest, Inc.)
- Trading as a Business Workshop
- VectorVest 7 EOD
- VectorVest 7 RealTime/IntraDay
- VectorVest AutoTester
- VectorVest Educational Services
- VectorVest OnLine
- VectorVest Options Analyzer
- VectorVest ProGraphics v6.0
- VectorVest ProTrader 7
- VectorVest RealTime Derby Tool
- VectorVest Simulator
- VectorVest Variator
- VectorVest Watchdog
