HOT TOPICS LIST
- MACD
- Fibonacci
- RSI
- Gann
- ADXR
- Stochastics
- Volume
- Triangles
- Futures
- Cycles
- Volatility
- ZIGZAG
- MESA
- Retracement
- Aroon
INDICATORS LIST
LIST OF TOPICS
PRINT THIS ARTICLE
by David Penn
I don't know if there is a bubble in housing. But there's been an exhaustion gap in the homebuilder's index. And it just got filled to the downside.
Position: N/A
David Penn
Technical Writer for Technical Analysis of STOCKS & COMMODITIES magazine, Working-Money.com, and Traders.com Advantage.
PRINT THIS ARTICLE
GAPS
The Homebuilding Gap
07/01/04 09:51:22 AMby David Penn
I don't know if there is a bubble in housing. But there's been an exhaustion gap in the homebuilder's index. And it just got filled to the downside.
Position: N/A
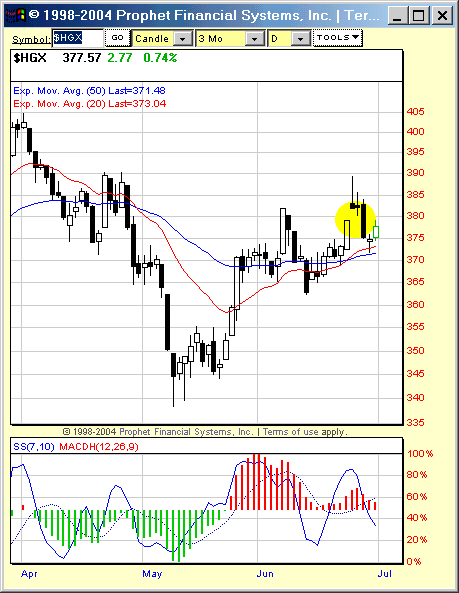
Meaning no disrespect to the contemporary cohort of technical analysts, I have to admit that sometimes there's nothing better than consulting a classic source on a relatively commonplace phenomenon like an exhaustion gap up being filled. Here are Robert Edwards and John Magee from their 1948 classic book, Technical Analysis of Stock Trends:The breakout gap signalizes the start of a move; the runaway gap marks its rapid continuation at or near its halfway point; the exhaustion gap comes at the end. The first two of these are easily distinguished as to type by their location with respect to the preceding price pattern, but the last is not always immediately distinguishable from the second. |
Nevertheless, Edwards and Magee provide a few clues suggesting the gap in the homebuilder's index is in fact an exhaustion gap:Runaway gaps are usually not covered for a considerable length of time, not as a rule until the market stages a swing of Major or full Intermediate proportions in the opposite direction. But exhaustion gaps are quickly closed, most often within two to five days, a fact which furnishes a final clue to distinguish exhaustion from continuation if it should still be needed at that stage. Edwards and Magee add that an exhaustion gap is not necessarily a sign of a "Major reversal, nor even necessarily of reversal at all." It calls "stop" they write, and suggest that further "pattern development" is important in making any sort of final determination. |

|
| The rally in the homebuilding index runs into resistance at the late April 2004 highs near 390. |
| Graphic provided by: Prophet Financial Systems, Inc.. |
| |
| And here, the filling of the exhaustion gap up in the homebuilding index ($HGX) has so many bearish features I can't help but worry that some sort of fake out back to the upside is likely. But when the broader technical picture is considered: the negative divergence between the late May and early June higher highs in price and the lower highs in the stochastic, the shooting star reversal candlestick on June 24th, the flattening of the exponential moving averages (with the shorter-term [20] EMA fighting to climb back above the longer-term [50] EMA), it is hard to look at the June 28th filling of the recent gap up and not come to bearish conclusions. |
| In addition, this exhaustion gap, coming on the tail end of the index's six week rally from the early May lows, was also arriving in advance of the Federal Reserve Board's widely-anticipated meeting on June 30th, during which they were expected (I say "expected" because there is no stronger word that comes to mind) to raise the cash rate (the Fed funds rate) by 25 basis points from 1.00% to 1.25%. As the most sensitive of interest-rate sensitive sectors, the price action in the homebuilding index leading into this event could be indicative of how other interest-rate sensitive sectors of the market might perform going forward. |
Technical Writer for Technical Analysis of STOCKS & COMMODITIES magazine, Working-Money.com, and Traders.com Advantage.
| Title: | Technical Writer |
| Company: | Technical Analysis, Inc. |
| Address: | 4757 California Avenue SW |
| Seattle, WA 98116 | |
| Phone # for sales: | 206 938 0570 |
| Fax: | 206 938 1307 |
| Website: | www.Traders.com |
| E-mail address: | DPenn@traders.com |
Traders' Resource Links | |
| Charting the Stock Market: The Wyckoff Method -- Books | |
| Working-Money.com -- Online Trading Services | |
| Traders.com Advantage -- Online Trading Services | |
| Technical Analysis of Stocks & Commodities -- Publications and Newsletters | |
| Working Money, at Working-Money.com -- Publications and Newsletters | |
| Traders.com Advantage -- Publications and Newsletters | |
| Professional Traders Starter Kit -- Software | |
Click here for more information about our publications!
PRINT THIS ARTICLE

Request Information From Our Sponsors
- StockCharts.com, Inc.
- Candle Patterns
- Candlestick Charting Explained
- Intermarket Technical Analysis
- John Murphy on Chart Analysis
- John Murphy's Chart Pattern Recognition
- John Murphy's Market Message
- MurphyExplainsMarketAnalysis-Intermarket Analysis
- MurphyExplainsMarketAnalysis-Visual Analysis
- StockCharts.com
- Technical Analysis of the Financial Markets
- The Visual Investor
- VectorVest, Inc.
- Executive Premier Workshop
- One-Day Options Course
- OptionsPro
- Retirement Income Workshop
- Sure-Fire Trading Systems (VectorVest, Inc.)
- Trading as a Business Workshop
- VectorVest 7 EOD
- VectorVest 7 RealTime/IntraDay
- VectorVest AutoTester
- VectorVest Educational Services
- VectorVest OnLine
- VectorVest Options Analyzer
- VectorVest ProGraphics v6.0
- VectorVest ProTrader 7
- VectorVest RealTime Derby Tool
- VectorVest Simulator
- VectorVest Variator
- VectorVest Watchdog
