HOT TOPICS LIST
- MACD
- Fibonacci
- RSI
- Gann
- ADXR
- Stochastics
- Volume
- Triangles
- Futures
- Cycles
- Volatility
- ZIGZAG
- MESA
- Retracement
- Aroon
INDICATORS LIST
LIST OF TOPICS
PRINT THIS ARTICLE
by David Penn
A negative stochastic divergence should have sent bulls scrambling. Instead a new high in the S&P 500 made short work of the bears.
Position: N/A
David Penn
Technical Writer for Technical Analysis of STOCKS & COMMODITIES magazine, Working-Money.com, and Traders.com Advantage.
PRINT THIS ARTICLE
STOCHASTICS
Denying The Divergence
06/29/04 10:00:49 AMby David Penn
A negative stochastic divergence should have sent bulls scrambling. Instead a new high in the S&P 500 made short work of the bears.
Position: N/A
| What's not to love about divergences? Breakouts are great -- the bedrock of many technical strategies. But half the time a breakout isn't a time to buy, it's just another signal: will the stock pull back to allow a cheaper long entry? Is this a false move? Has it already run too far too soon? Should I chase it -- just a little bit? |
| But divergences between price action and oscillators like RSI, the stochastic, and others never fail to give technicians the sense of not only opportunity, but also prescience. Divergences make you feel, erroneously, as if you're seeing something that other people aren't. Maybe only the blind miss breakouts. But what technician hasn't at some point in their practice looked at a price chart, spotted a sizable divergence between price and oscillator and asked him or herself: "What are they doing buying/selling that here?! Don't they see the divergence looking them straight in the face?!?!?!" Unfortunately, divergences sometimes aren't all they are cracked up to be. At least, this has been the experience of those watching -- and trying to trade through -- the now triple-set negative stochastic divergence challenging the S&P 500's now six-week rally. |

|
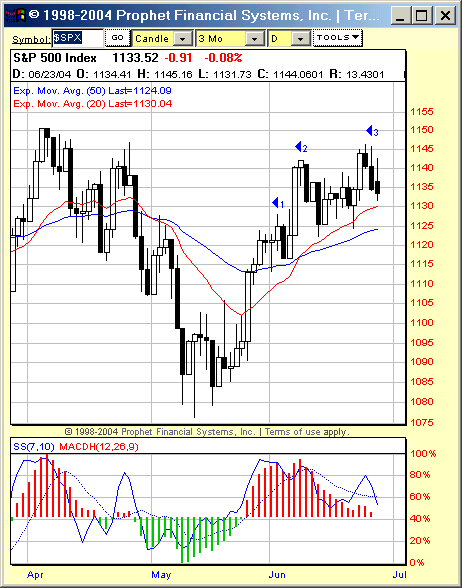
| Three successively higher highs in the S&P 500 are met with three successively lower highs in the stochastic. Will this negative divergence ever work out for the bears? |
| Graphic provided by: Prophet Financial Systems, Inc.. |
| |
| The initial negative divergence came on June 9th, as the S&P 500 corrected from a rally peak. This higher high in the S&P 500 vis-a-vis the June 2nd rally peak, however, was not matched with a higher high in the stochastic. Given the looming resistance, technicians could have been forgiven for thinking that the June 9th correction would spell the end of the rally. Instead, the correction halted fairly shortly afterward, as the S&P 500 moved sideways for about six days before breaking out and setting still yet another new high for the move since the mid-May lows. And as fate would have it, this new high, higher than both the June 9th and June 2nd rally peaks, was accompanied by a second consecutively lower stochastic high. |
| If this wasn't enough to drive the bears crazy, then the S&P 500's next move might have finally done it. On June 24th, the S&P 500 went on to record still-yet-another higher high. The 7,10 stochastic? Another lower high. |
| Should the S&P 500 move strongly higher, then it is likely to drag the stochastic higher as well, making the consecutively lower stochastic peaks in between June 2nd and the new stochastic high irrelevant. But technicians who have come to love the certainty of divergences have been forced to confront the reality of a rally that may be close but is not yet ready to call it a day. |
Technical Writer for Technical Analysis of STOCKS & COMMODITIES magazine, Working-Money.com, and Traders.com Advantage.
| Title: | Technical Writer |
| Company: | Technical Analysis, Inc. |
| Address: | 4757 California Avenue SW |
| Seattle, WA 98116 | |
| Phone # for sales: | 206 938 0570 |
| Fax: | 206 938 1307 |
| Website: | www.Traders.com |
| E-mail address: | DPenn@traders.com |
Traders' Resource Links | |
| Charting the Stock Market: The Wyckoff Method -- Books | |
| Working-Money.com -- Online Trading Services | |
| Traders.com Advantage -- Online Trading Services | |
| Technical Analysis of Stocks & Commodities -- Publications and Newsletters | |
| Working Money, at Working-Money.com -- Publications and Newsletters | |
| Traders.com Advantage -- Publications and Newsletters | |
| Professional Traders Starter Kit -- Software | |
Click here for more information about our publications!
PRINT THIS ARTICLE

|

Request Information From Our Sponsors
- StockCharts.com, Inc.
- Candle Patterns
- Candlestick Charting Explained
- Intermarket Technical Analysis
- John Murphy on Chart Analysis
- John Murphy's Chart Pattern Recognition
- John Murphy's Market Message
- MurphyExplainsMarketAnalysis-Intermarket Analysis
- MurphyExplainsMarketAnalysis-Visual Analysis
- StockCharts.com
- Technical Analysis of the Financial Markets
- The Visual Investor
- VectorVest, Inc.
- Executive Premier Workshop
- One-Day Options Course
- OptionsPro
- Retirement Income Workshop
- Sure-Fire Trading Systems (VectorVest, Inc.)
- Trading as a Business Workshop
- VectorVest 7 EOD
- VectorVest 7 RealTime/IntraDay
- VectorVest AutoTester
- VectorVest Educational Services
- VectorVest OnLine
- VectorVest Options Analyzer
- VectorVest ProGraphics v6.0
- VectorVest ProTrader 7
- VectorVest RealTime Derby Tool
- VectorVest Simulator
- VectorVest Variator
- VectorVest Watchdog
