HOT TOPICS LIST
- MACD
- Fibonacci
- RSI
- Gann
- ADXR
- Stochastics
- Volume
- Triangles
- Futures
- Cycles
- Volatility
- ZIGZAG
- MESA
- Retracement
- Aroon
INDICATORS LIST
LIST OF TOPICS
PRINT THIS ARTICLE
by Gary Grosschadl
This stock is looking toppy in a rising channel.
Position: Sell
Gary Grosschadl
Independent Canadian equities trader and technical analyst based in Peterborough
Ontario, Canada.
PRINT THIS ARTICLE
CHART ANALYSIS
Biogen Idec Inc. (BIIB) Rise Looking Dubious
06/30/04 04:24:22 PMby Gary Grosschadl
This stock is looking toppy in a rising channel.
Position: Sell
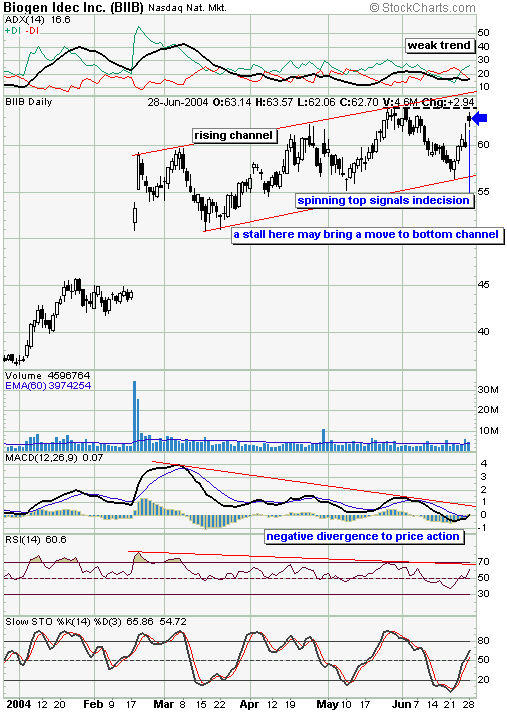
| Biogen Idec has been on an upward tear since gapping above $50 last February. This bullish drive has resulted in a bullish rising channel, but a closer look shows some concerns. |
| The last trading session resulted in a spinning top forming. This small bodied candle with upper and lower shadows is a sign of indecision that often means a loss of upward momentum. This candlestick needs to be confirmed with more downside as an upside move here can negate the bearish implication. The fact that it occurs very near the previous top adds significance. A stall here could bring a downleg to challenge the bottom of the channel. |

|
| Biogen's daily chart shows a rising channel with some concerns. |
| Graphic provided by: Stockcharts.com. |
| |
| When considering several indicators, bigger downside possibilities emerge. Three negative divergences hint at something amiss with the positive nature of this rising channel. |
| The ADX or strength component of the uppermost graph has been weak, at less than 20 for most of this channel duration. This hints that this structure may have a weak foundation. The MACD (moving average convergence/divergence) indicator and the RSI (relative strength indicator) both show negative divergences to price action. Their downward slopes show waning strength while the stock price has been climbing. |
| The question looking ahead is whether or not the downleg (assuming it does occur) is merely a move to again bounce off the lower trendline or whether this channel structure breaks to the downside. If this does occur, a move to test the top of the gap near $50 could be a possibility. |
Independent Canadian equities trader and technical analyst based in Peterborough
Ontario, Canada.
| Website: | www.whatsonsale.ca/financial.html |
| E-mail address: | gwg7@sympatico.ca |
Click here for more information about our publications!
PRINT THIS ARTICLE

|

Request Information From Our Sponsors
- StockCharts.com, Inc.
- Candle Patterns
- Candlestick Charting Explained
- Intermarket Technical Analysis
- John Murphy on Chart Analysis
- John Murphy's Chart Pattern Recognition
- John Murphy's Market Message
- MurphyExplainsMarketAnalysis-Intermarket Analysis
- MurphyExplainsMarketAnalysis-Visual Analysis
- StockCharts.com
- Technical Analysis of the Financial Markets
- The Visual Investor
- VectorVest, Inc.
- Executive Premier Workshop
- One-Day Options Course
- OptionsPro
- Retirement Income Workshop
- Sure-Fire Trading Systems (VectorVest, Inc.)
- Trading as a Business Workshop
- VectorVest 7 EOD
- VectorVest 7 RealTime/IntraDay
- VectorVest AutoTester
- VectorVest Educational Services
- VectorVest OnLine
- VectorVest Options Analyzer
- VectorVest ProGraphics v6.0
- VectorVest ProTrader 7
- VectorVest RealTime Derby Tool
- VectorVest Simulator
- VectorVest Variator
- VectorVest Watchdog
