HOT TOPICS LIST
- MACD
- Fibonacci
- RSI
- Gann
- ADXR
- Stochastics
- Volume
- Triangles
- Futures
- Cycles
- Volatility
- ZIGZAG
- MESA
- Retracement
- Aroon
INDICATORS LIST
LIST OF TOPICS
PRINT THIS ARTICLE
by Gary Grosschadl
J.P. Morgan Chase & Co. (JPM) hits a previous congestion zone which now looks to become significant resistance.
Position: Sell
Gary Grosschadl
Independent Canadian equities trader and technical analyst based in Peterborough
Ontario, Canada.
PRINT THIS ARTICLE
CHART ANALYSIS
Downside Possibility For J.P. Morgan Chase & Co.
06/29/04 10:18:08 AMby Gary Grosschadl
J.P. Morgan Chase & Co. (JPM) hits a previous congestion zone which now looks to become significant resistance.
Position: Sell
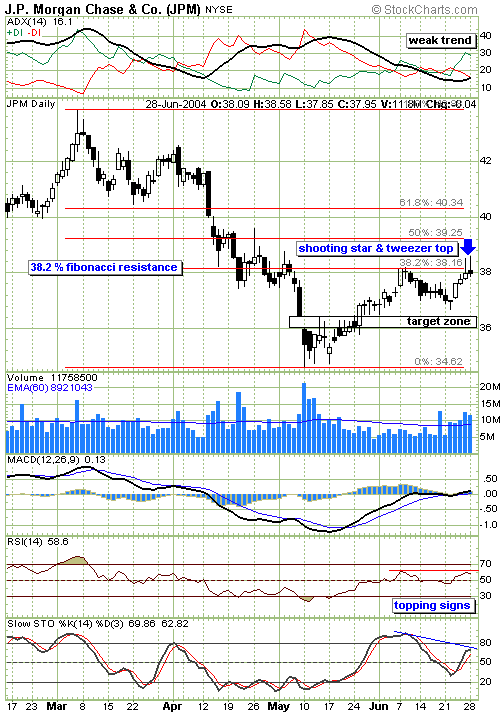
| Last May JPM reversed its downward slide and began rising until it hit a congestion zone. This zone, in the $38 area, is the same place where the stock stalled in the latter part of April. It also relates to the classic Fibonacci level of 38.2%. |
| The previous April stall ended with a harami candlestick formation occuring in early June, just above $38. A harami is a two candle formation, with a small candle body forming after a large bullish candlestick. The smaller, second body falls within the open and closing values of the larger candlestick. The formation portends a reversal pattern. In this instance because the small candle body is actually a doji (same open and close, resulting in a cross shape), the pattern is called a harami cross. |

|
| Daily chart for J.P.Morgan. |
| Graphic provided by: Stockcharts.com. |
| |
| Another candlestick pattern also hints at a balk near $38. Two shooting star candlesticks (small bodies with long upper shadows) have formed, and the two together form a possible tweezer top (two matching tops that often look like tweezers). This hints at a likely reversal. |
| Several indicators are worth noting. The ADX at the top of the chart is less than 20, indicating a weak trend. This trend strength component hints at a likely stall. The RSI (relative strength indicator) looks like a double top while the stochastics is showing signs of early failure as the top is starting to hinge. |
| Should a reversal be in the cards, a target zone is suggested in the form of a previous gap area from $36 to 36.40. Previous gaps are often filled, and in doing so become common areas of support and resistance. |
Independent Canadian equities trader and technical analyst based in Peterborough
Ontario, Canada.
| Website: | www.whatsonsale.ca/financial.html |
| E-mail address: | gwg7@sympatico.ca |
Click here for more information about our publications!
Comments

Request Information From Our Sponsors
- StockCharts.com, Inc.
- Candle Patterns
- Candlestick Charting Explained
- Intermarket Technical Analysis
- John Murphy on Chart Analysis
- John Murphy's Chart Pattern Recognition
- John Murphy's Market Message
- MurphyExplainsMarketAnalysis-Intermarket Analysis
- MurphyExplainsMarketAnalysis-Visual Analysis
- StockCharts.com
- Technical Analysis of the Financial Markets
- The Visual Investor
- VectorVest, Inc.
- Executive Premier Workshop
- One-Day Options Course
- OptionsPro
- Retirement Income Workshop
- Sure-Fire Trading Systems (VectorVest, Inc.)
- Trading as a Business Workshop
- VectorVest 7 EOD
- VectorVest 7 RealTime/IntraDay
- VectorVest AutoTester
- VectorVest Educational Services
- VectorVest OnLine
- VectorVest Options Analyzer
- VectorVest ProGraphics v6.0
- VectorVest ProTrader 7
- VectorVest RealTime Derby Tool
- VectorVest Simulator
- VectorVest Variator
- VectorVest Watchdog
