HOT TOPICS LIST
- MACD
- Fibonacci
- RSI
- Gann
- ADXR
- Stochastics
- Volume
- Triangles
- Futures
- Cycles
- Volatility
- ZIGZAG
- MESA
- Retracement
- Aroon
INDICATORS LIST
LIST OF TOPICS
PRINT THIS ARTICLE
by David Penn
A bounce after a shallow correction helped form the support line that was broken by recent price action.
Position: N/A
David Penn
Technical Writer for Technical Analysis of STOCKS & COMMODITIES magazine, Working-Money.com, and Traders.com Advantage.
PRINT THIS ARTICLE
THE DIAMOND
Heating Oil's Diamond Top?
06/29/04 08:58:58 AMby David Penn
A bounce after a shallow correction helped form the support line that was broken by recent price action.
Position: N/A
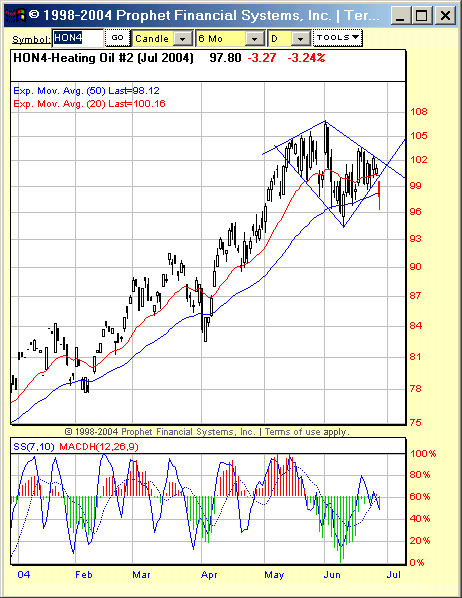
| In an upcoming article for Working-Money.com, I discussed a variety of techniques for picking market tops ("Topping and the Energy Complex"). While I didn't mention chart patterns in that article, the pattern unfolding in July heating oil (HON4) adds to the bearish intermediate-term look on the energies. The pattern is a diamond -- quite possibly a diamond top. This pattern began in early May, as July heating oil was moving into new highs. Simultaneously, the range began to increase, forming the sort of "megaphone" look characteristic of broadening formations -- or the first half of a diamond. |
| One of the easiest ways to spot a diamond -- in addition to the initial broadening "megaphone" -- is to see that market make a top, then a short pullback to form the bottom of the diamond. After this, I start looking for the opposite type of price pattern on the right side of the formation; namely, a shrinking range that may or may not look like a symmetrical triangle. It is this last price action, which typically represents a small bounce from the recent correction low, that forms the lower (and upper) right sides of the diamond, with the lower right side becoming the support beneath which a successful price breakout must travel. |

|
| July heating oil breaks down from a diamond pattern in late June. Beyond the bottom of the pattern, the nearest support is at 90. |
| Graphic provided by: Prophet Financial Systems, Inc.. |
| |
| Note also how there is a growing negative divergence between the price action in July heating oil and the stochastic oscillator in early May through the balance of the month. By the time HON4 topped, the stochastic was marking its third consecutively lower peak. Here, in the case of July heating oil, prices have broken out from the support area on the right side, and have penetrated the support provided by the 50-day exponential moving average. |
| Important resistance lies at the bottom end of the diamond, right now just under the 50-day EMA at about 94.50. Often, breakouts from diamond patterns begin in an initial direction, only to find resistance at one end of the diamond and suddenly reverse themselves, turning breakouts into breakdowns and breakdowns into often stunning moves to the upside. |
| Given the size of this diamond and a breakout level of about 100.70, a move as high as 112.94 or as low as 88.46. In the first instance, look for HON4 (or, perhaps, HOU4, the September contract) to trade toward the pre-Iraq invasion highs of mid-March 2003 (near 113, basis continuous futures). In the second instance, look for heating oil to correct toward a test of the mid-April 2004 lows between roughly 89 and 83. |
Technical Writer for Technical Analysis of STOCKS & COMMODITIES magazine, Working-Money.com, and Traders.com Advantage.
| Title: | Technical Writer |
| Company: | Technical Analysis, Inc. |
| Address: | 4757 California Avenue SW |
| Seattle, WA 98116 | |
| Phone # for sales: | 206 938 0570 |
| Fax: | 206 938 1307 |
| Website: | www.Traders.com |
| E-mail address: | DPenn@traders.com |
Traders' Resource Links | |
| Charting the Stock Market: The Wyckoff Method -- Books | |
| Working-Money.com -- Online Trading Services | |
| Traders.com Advantage -- Online Trading Services | |
| Technical Analysis of Stocks & Commodities -- Publications and Newsletters | |
| Working Money, at Working-Money.com -- Publications and Newsletters | |
| Traders.com Advantage -- Publications and Newsletters | |
| Professional Traders Starter Kit -- Software | |
Click here for more information about our publications!
PRINT THIS ARTICLE

Request Information From Our Sponsors
- StockCharts.com, Inc.
- Candle Patterns
- Candlestick Charting Explained
- Intermarket Technical Analysis
- John Murphy on Chart Analysis
- John Murphy's Chart Pattern Recognition
- John Murphy's Market Message
- MurphyExplainsMarketAnalysis-Intermarket Analysis
- MurphyExplainsMarketAnalysis-Visual Analysis
- StockCharts.com
- Technical Analysis of the Financial Markets
- The Visual Investor
- VectorVest, Inc.
- Executive Premier Workshop
- One-Day Options Course
- OptionsPro
- Retirement Income Workshop
- Sure-Fire Trading Systems (VectorVest, Inc.)
- Trading as a Business Workshop
- VectorVest 7 EOD
- VectorVest 7 RealTime/IntraDay
- VectorVest AutoTester
- VectorVest Educational Services
- VectorVest OnLine
- VectorVest Options Analyzer
- VectorVest ProGraphics v6.0
- VectorVest ProTrader 7
- VectorVest RealTime Derby Tool
- VectorVest Simulator
- VectorVest Variator
- VectorVest Watchdog
