HOT TOPICS LIST
- MACD
- Fibonacci
- RSI
- Gann
- ADXR
- Stochastics
- Volume
- Triangles
- Futures
- Cycles
- Volatility
- ZIGZAG
- MESA
- Retracement
- Aroon
INDICATORS LIST
LIST OF TOPICS
PRINT THIS ARTICLE
by Steven Coffey
Exelixis, Inc. (EXEL) has been rising in an ascending triangle since October 2002, and is just beginning its breakout on strong volume.
Position: Buy
Steven Coffey
Steven Coffey is an independent stock trader with a background in Information Systems development and training. He resides in the Boston area.
PRINT THIS ARTICLE
ASCENDING TRIANGLES
Exelixis, Inc. Breaking Out Of Ascending Triangle
06/29/04 08:06:56 AMby Steven Coffey
Exelixis, Inc. (EXEL) has been rising in an ascending triangle since October 2002, and is just beginning its breakout on strong volume.
Position: Buy
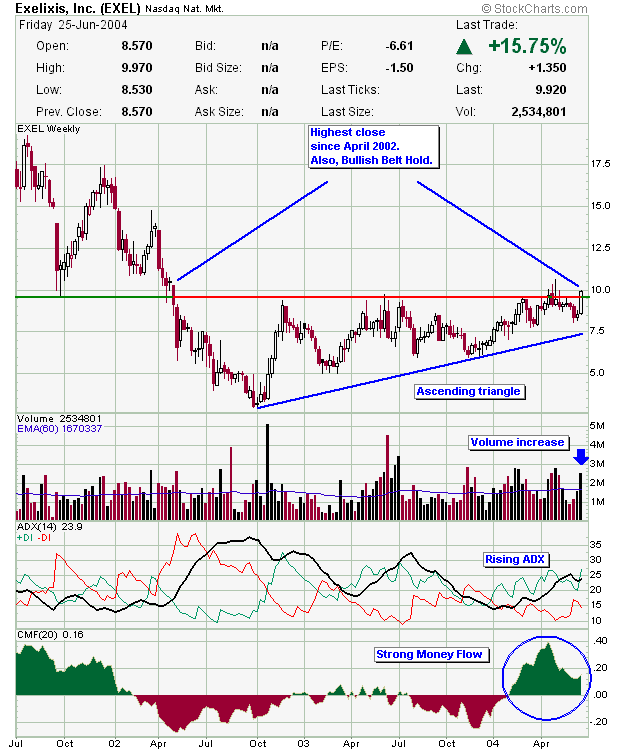
| One of the bullish breakout plays is a formation known as an ascending triangle. Looking at the chart, you can see how it got its name. This type of formation occurs when a stock bottoms out in a downtrend and then proceeds upward along a trendline. However, while it makes higher lows (which is a bullish change from the prior downtrend), it has a tendency to run up to a certain resistance level and then recede. This is because the individuals who bought the security during the downtrend are getting out at what they perceive to be the best possible price. Selling pressure at this resistance level causes the price to bounce down off of it. But what happens when all of those disgusted investors who bought during the downtrend are out of the picture? The selling pressure at that resistance level disappears, and the price breaks out of the ascending triangle. This is what happened last week with Exelixis. |

|
| Graphic provided by: Stockcharts.com. |
| |
| EXEL's close on Friday at $9.92 was the highest close since April 2002. I also like the bullish "belt-hold" candlestick that last week's activity produced. This type of candlestick forms when a stock opens at or near its low for that session, and then closes at or near its high. Its bullish implications are stronger when it is accompanied by an increase in volume, which was the case last week. |
| The indicators in the bottom half of the chart also look positive. The ADX has been rising since the beginning of the year, indicating an increase in the strength of the trend. This should help EXEL increase with more vigor now that it has broken out. Also rising, almost in perfect tandem with the ADX, is the Chaikin money flow indicator. In fact, in April, it rose to its highest point on this three-year chart. The money flow indicator illustrates the relationship between buying and selling pressure. This stock's massive increase in the money flow indicates strong accumulation. |
| Buying on a breakout from an ascending triangle is a pretty reliable play. To calculate an upside target, subtract the low point of the triangle ($3) from the high point ($9.50), and then add that amount ($6.50) to the high point. This would give Exelixis a target of $16. |
Steven Coffey is an independent stock trader with a background in Information Systems development and training. He resides in the Boston area.
| E-mail address: | stevencoffey@yahoo.com |
Click here for more information about our publications!
PRINT THIS ARTICLE

Request Information From Our Sponsors
- StockCharts.com, Inc.
- Candle Patterns
- Candlestick Charting Explained
- Intermarket Technical Analysis
- John Murphy on Chart Analysis
- John Murphy's Chart Pattern Recognition
- John Murphy's Market Message
- MurphyExplainsMarketAnalysis-Intermarket Analysis
- MurphyExplainsMarketAnalysis-Visual Analysis
- StockCharts.com
- Technical Analysis of the Financial Markets
- The Visual Investor
- VectorVest, Inc.
- Executive Premier Workshop
- One-Day Options Course
- OptionsPro
- Retirement Income Workshop
- Sure-Fire Trading Systems (VectorVest, Inc.)
- Trading as a Business Workshop
- VectorVest 7 EOD
- VectorVest 7 RealTime/IntraDay
- VectorVest AutoTester
- VectorVest Educational Services
- VectorVest OnLine
- VectorVest Options Analyzer
- VectorVest ProGraphics v6.0
- VectorVest ProTrader 7
- VectorVest RealTime Derby Tool
- VectorVest Simulator
- VectorVest Variator
- VectorVest Watchdog
