HOT TOPICS LIST
- MACD
- Fibonacci
- RSI
- Gann
- ADXR
- Stochastics
- Volume
- Triangles
- Futures
- Cycles
- Volatility
- ZIGZAG
- MESA
- Retracement
- Aroon
INDICATORS LIST
LIST OF TOPICS
PRINT THIS ARTICLE
by Steven Coffey
CKR recently made a strong volume breakout above its April 2002 high. What's more, it's just slightly above the breakout point.
Position: Buy
Steven Coffey
Steven Coffey is an independent stock trader with a background in Information Systems development and training. He resides in the Boston area.
PRINT THIS ARTICLE
ADXR
Breakout For CKE Restaurants
06/25/04 03:03:21 PMby Steven Coffey
CKR recently made a strong volume breakout above its April 2002 high. What's more, it's just slightly above the breakout point.
Position: Buy
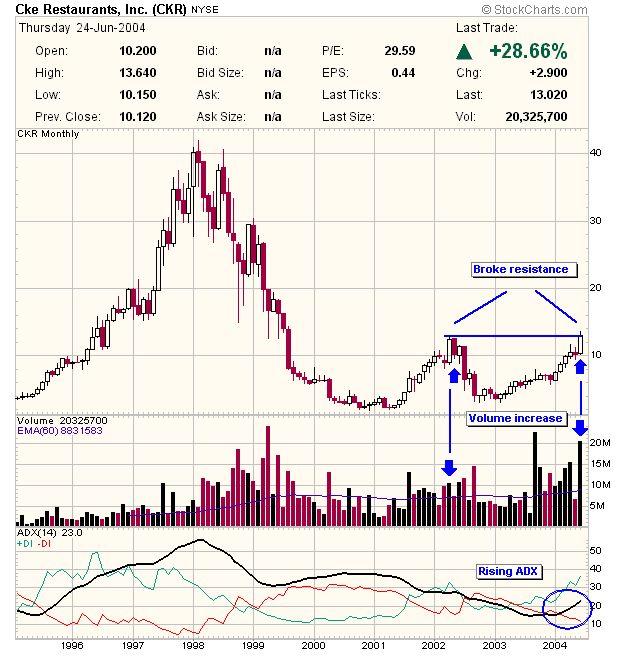
| Some chart patterns are really simple, and those are usually the best ones. It's amazing how much we can glean just by looking at price and volume, and maybe an oscillator or two to confirm the pattern. One such pattern is a breakout, as we can see in the monthly chart of CKR. |
| After bottoming out at about $2 in late 2000/early 2001, this stock climbed to a high of $12.85 in April 2002. Since then, it has gone down to about $3 in the autumn of 2002, at which point, it began its ascent to close at $13.02 on June 24 of this year, marking a breakout above its April 2002 high. When we see a breakout such as this, it doesn't mean a whole lot if there's no increase in volume. Remember, volume is the thrust that drives a stock upward. But CKR pulls through for us in this department as well as this month's volume is already over twice the volume of the April 2002 high, and the month isn't even over yet. Also, the overall trend of the volume since bottoming out in late 2000 has been in a healthy increase. |

|
| Figure 1: Monthly chart for CKR. |
| Graphic provided by: StockCharts.com. |
| |
| According to the basic tenets of technical analysis, this should be plenty enough to warrant a buy position on this stock. But one indicator I like on this chart is the ADX. You can see that from 1995 through 1997, CKE Restaurants enjoyed a robust bull run from about $3 to approximately $40. As the price increased, so did the ADX. This indicates that the strength of that trend also increased. After that point, the price came tumbling down, along with the ADX, which indicates a diminishing strength of the downtrend. The ADX bottomed out late last year below 20, and since then has increased to 23. The significant level to watch in the ADX is 20. When it goes below that, it indicates that the strength of the current trend is minimal. When the ADX rises above 20, the strength of the trend is considered to have bottomed out, and is now increasing again. As a result, the new price trend should start to pick up steam. Put all this together, and what I see is an increased strength in this new uptrend as time goes along. |
| I think that right now is a great time to buy CKR. The price/volume relationship is very bullish, and the ADX is showing an increase in the strength of the new uptrend. As for a price target, if we subtract the $2 low set in late 2000 from the $12.85 high set in April 2002, we get $10.85. We can then add that to the breakout point of $12.85, and we get a price target of $23.70. |
Steven Coffey is an independent stock trader with a background in Information Systems development and training. He resides in the Boston area.
| E-mail address: | stevencoffey@yahoo.com |
Click here for more information about our publications!
Comments

Request Information From Our Sponsors
- StockCharts.com, Inc.
- Candle Patterns
- Candlestick Charting Explained
- Intermarket Technical Analysis
- John Murphy on Chart Analysis
- John Murphy's Chart Pattern Recognition
- John Murphy's Market Message
- MurphyExplainsMarketAnalysis-Intermarket Analysis
- MurphyExplainsMarketAnalysis-Visual Analysis
- StockCharts.com
- Technical Analysis of the Financial Markets
- The Visual Investor
- VectorVest, Inc.
- Executive Premier Workshop
- One-Day Options Course
- OptionsPro
- Retirement Income Workshop
- Sure-Fire Trading Systems (VectorVest, Inc.)
- Trading as a Business Workshop
- VectorVest 7 EOD
- VectorVest 7 RealTime/IntraDay
- VectorVest AutoTester
- VectorVest Educational Services
- VectorVest OnLine
- VectorVest Options Analyzer
- VectorVest ProGraphics v6.0
- VectorVest ProTrader 7
- VectorVest RealTime Derby Tool
- VectorVest Simulator
- VectorVest Variator
- VectorVest Watchdog
