HOT TOPICS LIST
- MACD
- Fibonacci
- RSI
- Gann
- ADXR
- Stochastics
- Volume
- Triangles
- Futures
- Cycles
- Volatility
- ZIGZAG
- MESA
- Retracement
- Aroon
INDICATORS LIST
LIST OF TOPICS
PRINT THIS ARTICLE
by David Penn
Given the topping action in American International Group, the stock may want to take out an insurance policy on itself.
Position: N/A
David Penn
Technical Writer for Technical Analysis of STOCKS & COMMODITIES magazine, Working-Money.com, and Traders.com Advantage.
PRINT THIS ARTICLE
HEAD & SHOULDERS
AIG's Head And Shoulders Top
06/24/04 04:58:15 PMby David Penn
Given the topping action in American International Group, the stock may want to take out an insurance policy on itself.
Position: N/A
| Dow component American International Group (AIG) has had quite a run since the bull market bottom of March 2003. Closing at $44.70 on March 12 of that year, AIG went on to rally to $71.61 exactly one year later, an appreciation of some 60%. From mid-March 2004 to mid-April, AIG tacked on an additional six points, closing as high as $77.36. |
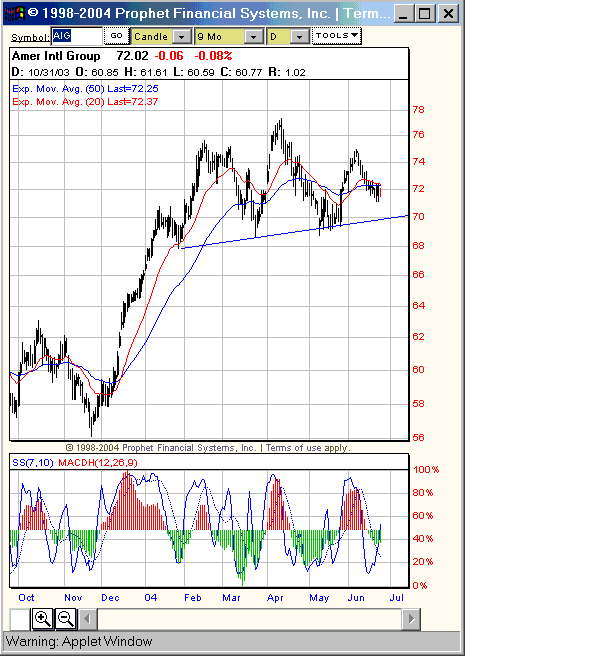
| But an intermediate-term look at the price action in AIG since autumn 2003 suggests that this powerful rally in the stock may be nearing an end. At a minimum, the head and shoulders top that AIG appears to have developed since the year began suggests a significant correction ahead; one that could see shares of AIG trading for as low as $60 over the next few months. |

|
| A successful breakdown from this head and shoulders top could send shares of AIG down to 60 in an initial move. |
| Graphic provided by: Prophet Financial Systems, Inc. |
| |
| Let's take a closer look at the head and shoulders top itself. As I mentioned, the pattern spans the length of AIG year-to-date. While there is a small, would-be "left shoulder" in the late December 2003/early January 2004 time frame, the first real "left shoulder" develops between the mid-January lows, peaks early in February and declines into the mid-March lows. The "head" of the head and shoulders pattern begins in the March lows, peaks late in the month, and declines into the mid-May lows. The "right shoulder" of this pattern begins in the mid-May lows, appears to peak toward the later end of the month, and is currently declining toward a neckline support level near 70. |
| I am using the low point of the head-potential right shoulder trough as my neckline support level for the entire pattern, a low point of about 68.73. This neckline support level slopes upward slightly, but I believe the pattern is clear. |
| With a pattern top of 77.36 and a neckline at 68.73, the measurement rule for head and shoulders tops suggests that a successful breakdown beneath support will send AIG down some 8.63 points in an initial move downward. Such a breakdown would mean that AIG would test 60 before the correction is complete. |
Technical Writer for Technical Analysis of STOCKS & COMMODITIES magazine, Working-Money.com, and Traders.com Advantage.
| Title: | Technical Writer |
| Company: | Technical Analysis, Inc. |
| Address: | 4757 California Avenue SW |
| Seattle, WA 98116 | |
| Phone # for sales: | 206 938 0570 |
| Fax: | 206 938 1307 |
| Website: | www.Traders.com |
| E-mail address: | DPenn@traders.com |
Traders' Resource Links | |
| Charting the Stock Market: The Wyckoff Method -- Books | |
| Working-Money.com -- Online Trading Services | |
| Traders.com Advantage -- Online Trading Services | |
| Technical Analysis of Stocks & Commodities -- Publications and Newsletters | |
| Working Money, at Working-Money.com -- Publications and Newsletters | |
| Traders.com Advantage -- Publications and Newsletters | |
| Professional Traders Starter Kit -- Software | |
Click here for more information about our publications!
PRINT THIS ARTICLE

Request Information From Our Sponsors
- VectorVest, Inc.
- Executive Premier Workshop
- One-Day Options Course
- OptionsPro
- Retirement Income Workshop
- Sure-Fire Trading Systems (VectorVest, Inc.)
- Trading as a Business Workshop
- VectorVest 7 EOD
- VectorVest 7 RealTime/IntraDay
- VectorVest AutoTester
- VectorVest Educational Services
- VectorVest OnLine
- VectorVest Options Analyzer
- VectorVest ProGraphics v6.0
- VectorVest ProTrader 7
- VectorVest RealTime Derby Tool
- VectorVest Simulator
- VectorVest Variator
- VectorVest Watchdog
- StockCharts.com, Inc.
- Candle Patterns
- Candlestick Charting Explained
- Intermarket Technical Analysis
- John Murphy on Chart Analysis
- John Murphy's Chart Pattern Recognition
- John Murphy's Market Message
- MurphyExplainsMarketAnalysis-Intermarket Analysis
- MurphyExplainsMarketAnalysis-Visual Analysis
- StockCharts.com
- Technical Analysis of the Financial Markets
- The Visual Investor
