HOT TOPICS LIST
- MACD
- Fibonacci
- RSI
- Gann
- ADXR
- Stochastics
- Volume
- Triangles
- Futures
- Cycles
- Volatility
- ZIGZAG
- MESA
- Retracement
- Aroon
INDICATORS LIST
LIST OF TOPICS
PRINT THIS ARTICLE
by Gary Grosschadl
The US Dollar Index has fallen substantially in the past two years. Now it faces some challenges if it hopes to turn around.
Position: Hold
Gary Grosschadl
Independent Canadian equities trader and technical analyst based in Peterborough
Ontario, Canada.
PRINT THIS ARTICLE
MOVING AVERAGES
The Challenge Ahead For The US Dollar Index
06/24/04 04:45:12 PMby Gary Grosschadl
The US Dollar Index has fallen substantially in the past two years. Now it faces some challenges if it hopes to turn around.
Position: Hold
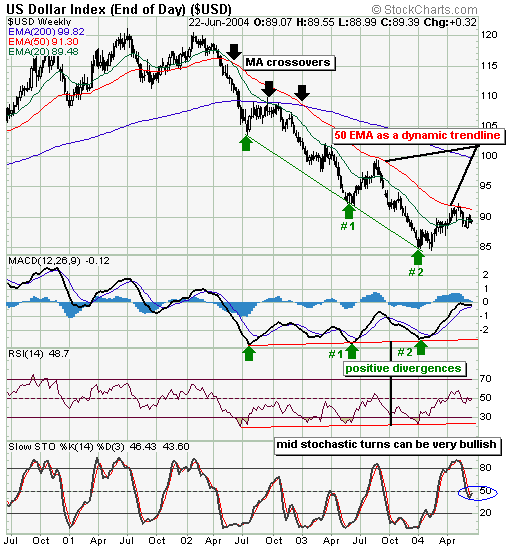
| This weekly chart aptly shows this currency index's fall from grace as it declined from a high of 120 to 85. Examining several moving averages puts this decline in perspective and serves to show the challenges ahead. |
| The early warning sign that a top may have been put in was the first meaningful MA crossover being the 20-week EMA through the 50-week EMA. Looking at the chart prior to this, all was quite bullish, as this shorter period moving average was positioned above the 50-week exponential moving average. After this bearish crossover, the USD remained in a bear trend as both MA lines continued their downward path, refusing to cross over again. |

|
| Moving averages seem to speak clearly on this weekly chart. |
| Graphic provided by: stockcharts.com. |
| |
| The next notable MA crossover was the 20-week down through the 200-week EMA. Note how this warned that the sideways consolidation would ultimately fail. As often the case, when the often-heeded 200-week MA becomes overhead resistance, a strong downtrend ensues. The next meaningful bearish crossover came as the 50-week EMA crossed below the 200-week EMA. Now the chart shows how well 50-week EMA acts as a dynamic trendline, rebuking the last two upswings. |
| An interesting observation is how the positive divergences shown by MACD and RSI indicators led to predictable upleg attempts, at least for those technicians who pay heed to such things. However, these proved to be only bear rallies in a downtrend. |
| Looking ahead, these same MAs can be used to determine whether a healthy advance occurs, leading to a possible change in trend. Look for proof of a turnaround by virtue of a 20/50 EMA cross, followed by 20/200 cross and then, finally, a 50/200 cross. By the time the latter occurs, a substantial rise will have taken place. However, first things first...the USD must rise above the 50-week EMA with more than a fleeting stab, as was recently done. One encouraging sign is shown by the stochastic indicator. It seems to be hinting at a mid stochastic turn. These can signal powerful advances, but it remains to be seen if this occurs with conviction. The path is defined for a substantial rise using the aforementioned moving averages, but will this path be taken? |
Independent Canadian equities trader and technical analyst based in Peterborough
Ontario, Canada.
| Website: | www.whatsonsale.ca/financial.html |
| E-mail address: | gwg7@sympatico.ca |
Click here for more information about our publications!
PRINT THIS ARTICLE

|

Request Information From Our Sponsors
- StockCharts.com, Inc.
- Candle Patterns
- Candlestick Charting Explained
- Intermarket Technical Analysis
- John Murphy on Chart Analysis
- John Murphy's Chart Pattern Recognition
- John Murphy's Market Message
- MurphyExplainsMarketAnalysis-Intermarket Analysis
- MurphyExplainsMarketAnalysis-Visual Analysis
- StockCharts.com
- Technical Analysis of the Financial Markets
- The Visual Investor
- VectorVest, Inc.
- Executive Premier Workshop
- One-Day Options Course
- OptionsPro
- Retirement Income Workshop
- Sure-Fire Trading Systems (VectorVest, Inc.)
- Trading as a Business Workshop
- VectorVest 7 EOD
- VectorVest 7 RealTime/IntraDay
- VectorVest AutoTester
- VectorVest Educational Services
- VectorVest OnLine
- VectorVest Options Analyzer
- VectorVest ProGraphics v6.0
- VectorVest ProTrader 7
- VectorVest RealTime Derby Tool
- VectorVest Simulator
- VectorVest Variator
- VectorVest Watchdog
