HOT TOPICS LIST
- MACD
- Fibonacci
- RSI
- Gann
- ADXR
- Stochastics
- Volume
- Triangles
- Futures
- Cycles
- Volatility
- ZIGZAG
- MESA
- Retracement
- Aroon
INDICATORS LIST
LIST OF TOPICS
PRINT THIS ARTICLE
by Koos van der Merwe
Microsoft has been very much in the news the past week. With its billions in cash, Microsoft speculation moves from offering its shareholders a comfortable dividend to a share buyback. Either way, it looks as though management's intention is to move the share price from the doldrums. What do the charts tell us?
Position: Accumulate
Koos van der Merwe
Has been a technical analyst since 1969, and has worked as a futures and options trader with First Financial Futures in Johannesburg, South Africa.
PRINT THIS ARTICLE
GANN ANGLE
Microsoft: Is It Worth Buying?
06/24/04 04:56:08 PMby Koos van der Merwe
Microsoft has been very much in the news the past week. With its billions in cash, Microsoft speculation moves from offering its shareholders a comfortable dividend to a share buyback. Either way, it looks as though management's intention is to move the share price from the doldrums. What do the charts tell us?
Position: Accumulate
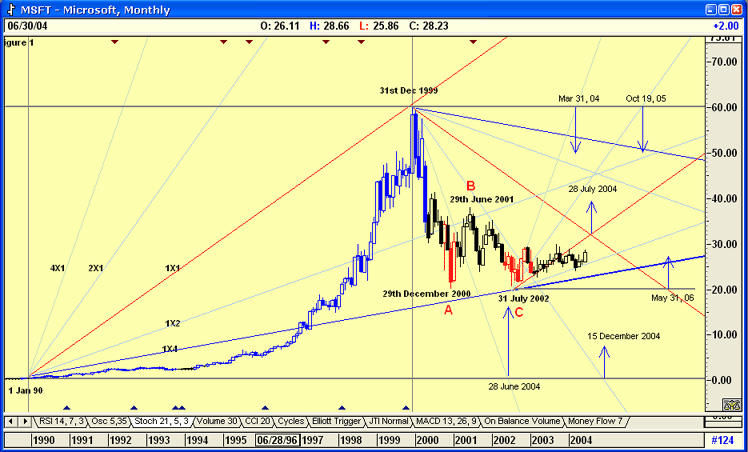
| Let me start with the monthly chart. In this chart I am using Gann angles to determine cyclical turning points and price movement. Microsoft topped on December 31, 1999 at $50.19. Since then, it has been falling in an ABC pattern with the low of the C-wave on July 31, 2002 almost kissing the Gann 1 x 4 angle. This low was also one month later than the Gann forecast of a turning point on June 28, 2004, an error that on a monthly chart is acceptable. Note how the price rose on the 1 x 4 angle of the Gann fan drawn from this low, fell through it, and found temporary support on the 1 x 1 angle before falling to find support on the 1 x 2 angle. Will the price now fall below the 1 x 2 angle? The chart suggests not, because the share price honored the Gann cycle low of the March 31, 2004. The chart is suggesting turning point on July 28, 2004 and December 15, 2004. If these suggested turning points are true, then we could expect a rise into July 2004, followed by a fall into December 2004. This would then be a wave 1 and wave 2 of a new bull trend in the share price. |
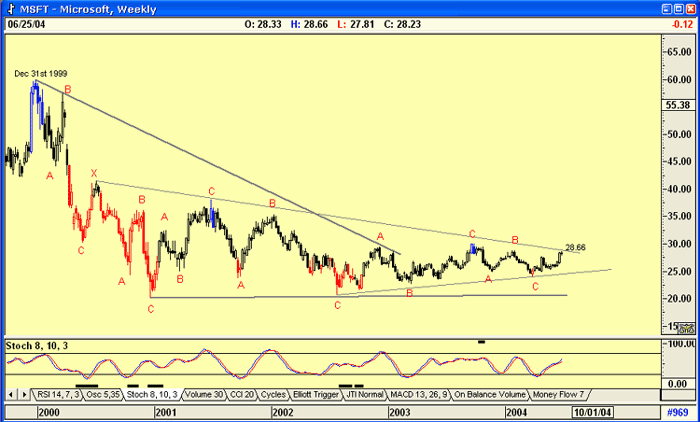
| The weekly chart simply shows that doldrums Microsoft is in. It has continually traced an ABC pattern since December 1999, forming what could be a descending triangle, but if this is so, then it would suggest a break down, and not the break up we are looking for. One ray of hope is that the price is at present touching a resistance level at 28.66. Should it break above this resistance, and decisively at that, then we could become a bit more optimistic. It is interesting that the stochastic indicator is on a bullish trend, suggesting that this may indeed occur. |

|
| Monthly chart of Microsoft with Gann fans and Elliott count. |
| Graphic provided by: AdvancedGET. |
| |
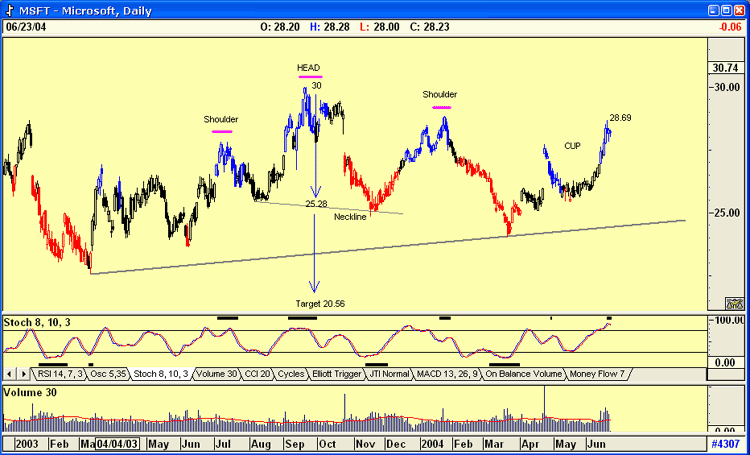
 Weekly chart for MSFT. A daily chart looks far more interesting. Here we see that Microsoft traced a Head and Shoulders pattern and has still to meet it's target of $20.56. The Stochastic oscillator is suggesting that the share price could indeed break down. What is contrary to this is the increased volume as the share price rose over the past few days. Rising volume with a rising price is bullish. |
 Daily chart for MSFT. So looking at the charts, what do I conclude? The monthly chart is suggesting a move up. The weekly chart is also suggesting a move up, but only if the share price break is above its resistance trendline. The daily chart is suggesting a short-term down move to form the handle to the cup and handle pattern that has formed. Because of this, I would wait for a break above 28.69 before buying. The target of 20.56 is a concern, so caution, in spite of all the bullish speculation remains. |
Has been a technical analyst since 1969, and has worked as a futures and options trader with First Financial Futures in Johannesburg, South Africa.
| Address: | 3256 West 24th Ave |
| Vancouver, BC | |
| Phone # for sales: | 6042634214 |
| E-mail address: | petroosp@gmail.com |
Click here for more information about our publications!
Comments
Date: 06/29/04Rank: 2Comment: Too complicated; and how was the
tgt of 20.56 arrived at?

|

Request Information From Our Sponsors
- StockCharts.com, Inc.
- Candle Patterns
- Candlestick Charting Explained
- Intermarket Technical Analysis
- John Murphy on Chart Analysis
- John Murphy's Chart Pattern Recognition
- John Murphy's Market Message
- MurphyExplainsMarketAnalysis-Intermarket Analysis
- MurphyExplainsMarketAnalysis-Visual Analysis
- StockCharts.com
- Technical Analysis of the Financial Markets
- The Visual Investor
- VectorVest, Inc.
- Executive Premier Workshop
- One-Day Options Course
- OptionsPro
- Retirement Income Workshop
- Sure-Fire Trading Systems (VectorVest, Inc.)
- Trading as a Business Workshop
- VectorVest 7 EOD
- VectorVest 7 RealTime/IntraDay
- VectorVest AutoTester
- VectorVest Educational Services
- VectorVest OnLine
- VectorVest Options Analyzer
- VectorVest ProGraphics v6.0
- VectorVest ProTrader 7
- VectorVest RealTime Derby Tool
- VectorVest Simulator
- VectorVest Variator
- VectorVest Watchdog
