HOT TOPICS LIST
- MACD
- Fibonacci
- RSI
- Gann
- ADXR
- Stochastics
- Volume
- Triangles
- Futures
- Cycles
- Volatility
- ZIGZAG
- MESA
- Retracement
- Aroon
INDICATORS LIST
LIST OF TOPICS
PRINT THIS ARTICLE
by Steven Coffey
With the close just above the stop-loss level, now could be a good time to buy STTS.
Position: Buy
Steven Coffey
Steven Coffey is an independent stock trader with a background in Information Systems development and training. He resides in the Boston area.
PRINT THIS ARTICLE
DOUBLE BOTTOMS
Double Bottom For ST Assembly Test Services Ltd.?
06/23/04 04:31:25 PMby Steven Coffey
With the close just above the stop-loss level, now could be a good time to buy STTS.
Position: Buy
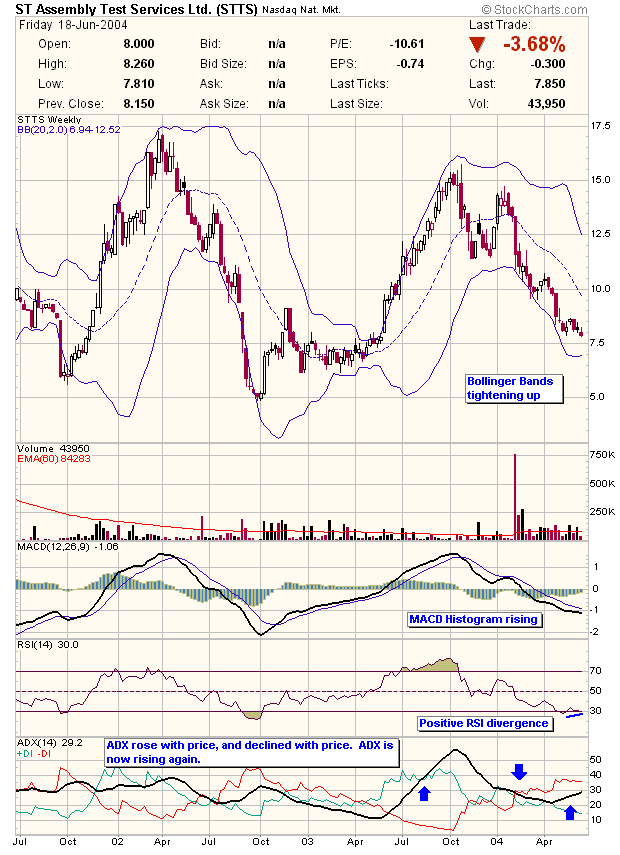
| ST Assembly Test Services (STTS) appears to be in the process of making a double bottom formation. While it hasn't made a breakout yet, what I like about this trade is that it made a slightly lower low on a significant decrease in volume, and the price is still just above the new low, presenting a golden opportunity to buy this stock at a great price. Its previous low of $7.89 was established on May 17 with 22,385 shares traded. On Friday, STTS made a low of $7.81, but with only 5,100 shares traded. This indicates that the selling pressure has dissipated, and this stock may be ready for a rebound. |
| Also, note on the chart how the Bollinger Bands are becoming narrower. The bottom band has started to come up, and when the price made its most recent low, it did so inside the bands for the first time in the downtrend since the beginning of the year. These two signals often signify a reversal of trend. |

|
| Figure 1: Weekly chart for STTS. |
| Graphic provided by: StockCharts.com. |
| |
| Looking at the MACD histogram (the bars above and below the centerline of the MACD indicator), you can see that this has been rising since making a low in March. In fact, if you look at the corresponding lows on the MACD histogram with the price lows set in March and April, the histogram is showing a bullish divergence, as April's histogram low is higher than March's, even though the price went down. This positive divergence is also playing itself out in the RSI. But another interesting indicator on this chart is the ADX. This indicator shows the strength of the trend. When STTS had a bull run from June to October, the ADX rose with the price trend. From October to April, while the price came down, so did the ADX. Since the ADX illustrates the strength of the trend, this means that the run up from June to October was part of the primary trend, and the down movement since then is only a retracement in an overall uptrend. What's more is that the ADX has been on the rise again since April, indicating that the primary uptrend may be starting up again. |
| While this stock hasn't begun rising yet, it is showing some telltale signs of that happening. And with the price just slightly above the low, this trade presents an excellent risk/reward ratio if you buy it at or near the current price. For those more conservative traders who would like to see a confirmation, keep your eye on this stock to see if it breaks above the late May high of about $8.75, particularly on an increase in volume. Look for STTS to run into some resistance at its March lows of about $9.25, which would coincide with the 20-week moving average. |
Steven Coffey is an independent stock trader with a background in Information Systems development and training. He resides in the Boston area.
| E-mail address: | stevencoffey@yahoo.com |
Click here for more information about our publications!
Comments
Date: 06/23/04Rank: 5Comment:

Request Information From Our Sponsors
- VectorVest, Inc.
- Executive Premier Workshop
- One-Day Options Course
- OptionsPro
- Retirement Income Workshop
- Sure-Fire Trading Systems (VectorVest, Inc.)
- Trading as a Business Workshop
- VectorVest 7 EOD
- VectorVest 7 RealTime/IntraDay
- VectorVest AutoTester
- VectorVest Educational Services
- VectorVest OnLine
- VectorVest Options Analyzer
- VectorVest ProGraphics v6.0
- VectorVest ProTrader 7
- VectorVest RealTime Derby Tool
- VectorVest Simulator
- VectorVest Variator
- VectorVest Watchdog
- StockCharts.com, Inc.
- Candle Patterns
- Candlestick Charting Explained
- Intermarket Technical Analysis
- John Murphy on Chart Analysis
- John Murphy's Chart Pattern Recognition
- John Murphy's Market Message
- MurphyExplainsMarketAnalysis-Intermarket Analysis
- MurphyExplainsMarketAnalysis-Visual Analysis
- StockCharts.com
- Technical Analysis of the Financial Markets
- The Visual Investor
