HOT TOPICS LIST
- MACD
- Fibonacci
- RSI
- Gann
- ADXR
- Stochastics
- Volume
- Triangles
- Futures
- Cycles
- Volatility
- ZIGZAG
- MESA
- Retracement
- Aroon
INDICATORS LIST
LIST OF TOPICS
PRINT THIS ARTICLE
by Kevin Hopson
Pitchfork channels can identify good buy and sell points, as illustrated by Meridian Resources Corp.
Position: N/A
Kevin Hopson
Kevin has been a technical analyst for roughly 10 years now. Previously, Kevin owned his own business and acted as a registered investment advisor, specializing in energy. He was also a freelance oil analyst for Orient Trading Co., a commodity futures trading firm in Japan. Kevin is currently a freelance writer.
PRINT THIS ARTICLE
CHANNEL LINES
Using Pitchfork Channels To Determine Support & Resistance
06/23/04 04:14:46 PMby Kevin Hopson
Pitchfork channels can identify good buy and sell points, as illustrated by Meridian Resources Corp.
Position: N/A
| As you probably know already, pitchfork analysis is my primary tool when evaluating stocks, commodities, or any other investment possibility. However, one aspect of pitchfork analysis that I rarely touch on - with the exception of my recent article on Plains Exploration and Production - is channel lines. When I say channel lines, I am not referring to traditional trendlines that connect high points or low points, though the idea is generally the same. To explain what I am talking about, it is best to start with the basics. |
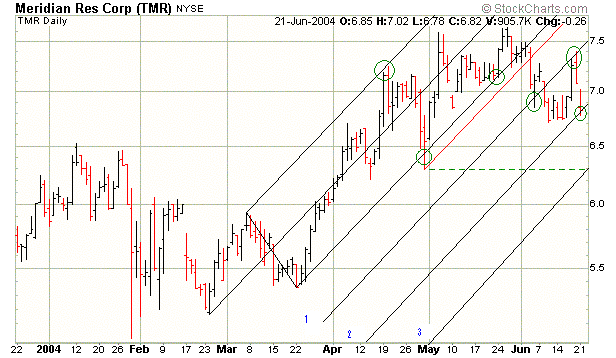
| For example, if you look at the six-month chart for Meridian Resources Corp. (TMR), you will notice the basic pitchfork configuration. Pitchforks are drawn by using three pivot points, either a high-low-high combination or a low-high-low combination. As you can see in the chart, I used a low-high-low combination. More specifically, I drew a line from the late Feb. 2004 low through the middle of the other two pivot points. Note how prices remained within this pitchfork for two months, finding resistance along the top parallel line and finding support along the lower parallel line. As long as these channel lines remain intact, you can sell resistance and buy support. |

|
| Graphic provided by: Stockcharts.com. |
| |
| You probably noticed the breach of support along the bottom parallel line in late April. As I have mentioned in prior articles (see "The Big Picture For Natural Gas"), we want to give prices the benefit of the doubt by drawing a sliding parallel line - or warning line - from the low. As you can see, prices remained above this warning line until early June, meaning that investors should have held Meridian up to this point. Once the warning line was breached, it was an indication to sell. |
| This is where my additional channel lines come into play. By measuring the distance from the median line of the black pitchfork to either the top or bottom parallel line, we can determine future support and resistance levels. More specifically, once you determine the distance, you can draw a trendline parallel to the bottom pitchfork line by this amount. This is illustrated in the chart as channel line 1. Note how prices initially found support here. |
| When prices breached this channel line, I drew another equidistant line. Note how the first channel line acted as resistance after it was broken. As you can see in the chart, the stock proceeded to pull back and is now testing support along the second channel line. If support fails to hold here, we could see a further pullback to the third channel line, which comes into play around the $6.30 level. This is also the site of the late April low, as illustrated by the dotted green line. As I stated before, pitchfork channels can be used to determine future support and resistance levels for just about any investment - not just stocks. The more you use channel lines and understand them, the more effective you will be in your trading. |
Kevin has been a technical analyst for roughly 10 years now. Previously, Kevin owned his own business and acted as a registered investment advisor, specializing in energy. He was also a freelance oil analyst for Orient Trading Co., a commodity futures trading firm in Japan. Kevin is currently a freelance writer.
| Glen Allen, VA | |
| E-mail address: | hopson_1@yahoo.com |
Click here for more information about our publications!
Comments

Request Information From Our Sponsors
- StockCharts.com, Inc.
- Candle Patterns
- Candlestick Charting Explained
- Intermarket Technical Analysis
- John Murphy on Chart Analysis
- John Murphy's Chart Pattern Recognition
- John Murphy's Market Message
- MurphyExplainsMarketAnalysis-Intermarket Analysis
- MurphyExplainsMarketAnalysis-Visual Analysis
- StockCharts.com
- Technical Analysis of the Financial Markets
- The Visual Investor
- VectorVest, Inc.
- Executive Premier Workshop
- One-Day Options Course
- OptionsPro
- Retirement Income Workshop
- Sure-Fire Trading Systems (VectorVest, Inc.)
- Trading as a Business Workshop
- VectorVest 7 EOD
- VectorVest 7 RealTime/IntraDay
- VectorVest AutoTester
- VectorVest Educational Services
- VectorVest OnLine
- VectorVest Options Analyzer
- VectorVest ProGraphics v6.0
- VectorVest ProTrader 7
- VectorVest RealTime Derby Tool
- VectorVest Simulator
- VectorVest Variator
- VectorVest Watchdog
