HOT TOPICS LIST
- MACD
- Fibonacci
- RSI
- Gann
- ADXR
- Stochastics
- Volume
- Triangles
- Futures
- Cycles
- Volatility
- ZIGZAG
- MESA
- Retracement
- Aroon
INDICATORS LIST
LIST OF TOPICS
PRINT THIS ARTICLE
by David Penn
Pattern perfection is sometimes not all it's cracked up to be.
Position: N/A
David Penn
Technical Writer for Technical Analysis of STOCKS & COMMODITIES magazine, Working-Money.com, and Traders.com Advantage.
PRINT THIS ARTICLE
DAY TRADING
The S&Ps Not-So-Symmetrical, Not-So-Perfect Intraday Triangle Breakdown
06/22/04 04:42:57 PMby David Penn
Pattern perfection is sometimes not all it's cracked up to be.
Position: N/A
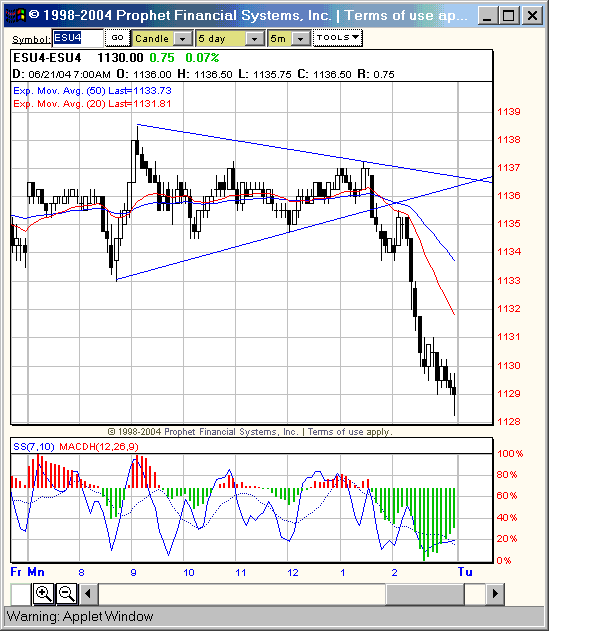
| Anyone who has been watching intraday action in the e-mini S&P over the last several days could be forgiven for not believing that anything meaningful would come from the symmetrical triangle that Monday (June 21st) price action fell into shortly after about 9 a.m. After all, the S&Ps have been notable for their inability to make a move of much conviction. So low has the volatility been that conspiracy theories (actually, one specific theory) have developed to explain why the S&P won't move. (The current theory has to do with a note circulated by a John MacKenzie from an alleged CME floor trader that suggests that "the entire S&P price action in the futures is being controlled by one counter-party... their CME clearing number is 990N and they clear through Gelber.") |
| Plunge Protection Team or no Plunge Protection Team, Market rigging or no... The fact is that more than a few e-mini daytraders have gotten the bends trying to trade the S&Ps of late--which may have contributed to the power in the breakdown that occurred on Monday a few hours before the close. |

|
| After a day of listless trading, this breakdown late in the session was a welcome relief for e-mini S&P bears. |
| Graphic provided by: Prophet Financial Systems, Inc. |
| |
| What happened? As the chart shows, the market had been trading in a contracting triangle since 9 a.m. (similar trading days were prevalent in previous weeks). I had come to expect little meaningful from such days, having seen breakout after breakout and breakdown after breakdown fail for lack of both volume and conviction. However, today was different: after trading in the triangle for most of the day, the September e-mini S&P broke down, reversed, and moved back into the pattern, then broke down for real. |
| Given the size of the triangle, approximately 5 points, and a breakdown level of about 1135.50, traders could have expected a minimal move to 1130.5. Insofar as the initial breakdown occurred around 1:30 p.m., there was plenty of time for daytraders to either jump on the breakdown immediately or to wait to see if the low established by the initial breakdown was taken out to the downside. |
| The initial breakdown low was indeed violated approximately 35 minutes after it was set. For traders dying for some real movement in the e-mini, this development was seismic. With an initial, post-breakdown low of about 1133.75, the September e-mini S&P fell back through this level and continued down sharply. The triangle breakdown target of 1130.5 was reached, and the market--after some brief sideways movement--continued down mildly, finishing the day session about another point lower. |
Technical Writer for Technical Analysis of STOCKS & COMMODITIES magazine, Working-Money.com, and Traders.com Advantage.
| Title: | Technical Writer |
| Company: | Technical Analysis, Inc. |
| Address: | 4757 California Avenue SW |
| Seattle, WA 98116 | |
| Phone # for sales: | 206 938 0570 |
| Fax: | 206 938 1307 |
| Website: | www.Traders.com |
| E-mail address: | DPenn@traders.com |
Traders' Resource Links | |
| Charting the Stock Market: The Wyckoff Method -- Books | |
| Working-Money.com -- Online Trading Services | |
| Traders.com Advantage -- Online Trading Services | |
| Technical Analysis of Stocks & Commodities -- Publications and Newsletters | |
| Working Money, at Working-Money.com -- Publications and Newsletters | |
| Traders.com Advantage -- Publications and Newsletters | |
| Professional Traders Starter Kit -- Software | |
Click here for more information about our publications!
Comments
Date: 06/22/04Rank: 5Comment:

|

Request Information From Our Sponsors
- VectorVest, Inc.
- Executive Premier Workshop
- One-Day Options Course
- OptionsPro
- Retirement Income Workshop
- Sure-Fire Trading Systems (VectorVest, Inc.)
- Trading as a Business Workshop
- VectorVest 7 EOD
- VectorVest 7 RealTime/IntraDay
- VectorVest AutoTester
- VectorVest Educational Services
- VectorVest OnLine
- VectorVest Options Analyzer
- VectorVest ProGraphics v6.0
- VectorVest ProTrader 7
- VectorVest RealTime Derby Tool
- VectorVest Simulator
- VectorVest Variator
- VectorVest Watchdog
- StockCharts.com, Inc.
- Candle Patterns
- Candlestick Charting Explained
- Intermarket Technical Analysis
- John Murphy on Chart Analysis
- John Murphy's Chart Pattern Recognition
- John Murphy's Market Message
- MurphyExplainsMarketAnalysis-Intermarket Analysis
- MurphyExplainsMarketAnalysis-Visual Analysis
- StockCharts.com
- Technical Analysis of the Financial Markets
- The Visual Investor
