

HOT TOPICS LIST
- MACD
- Fibonacci
- RSI
- Gann
- ADXR
- Stochastics
- Volume
- Triangles
- Futures
- Cycles
- Volatility
- ZIGZAG
- MESA
- Retracement
- Aroon
INDICATORS LIST
LIST OF TOPICS
PRINT THIS ARTICLE
by David Penn
A breakdown from this head and shoulders top could see lumber prices near 344.
Position: N/A
David Penn
Technical Writer for Technical Analysis of STOCKS & COMMODITIES magazine, Working-Money.com, and Traders.com Advantage.
PRINT THIS ARTICLE
HEAD & SHOULDERS
Is Lumber Headed Lower?
06/22/04 04:39:14 PMby David Penn
A breakdown from this head and shoulders top could see lumber prices near 344.
Position: N/A
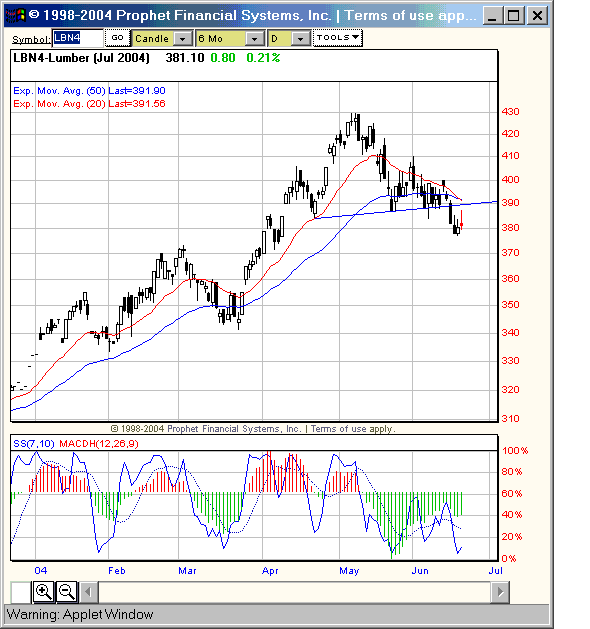
| No major trendlines were broken in the making of this bearish outlook on lumber futures (basis July). Nevertheless, a combination of factors--from a growing negative divergence between price action and the 7, 10 stochastic oscillator to declining intermediate-term moving averages--are conspiring to send lumber prices lower on at least an intermediate-term basis. |
| Again, July lumber's recent slip from its May peak of 429.50 has not yet been accompanied by a break of a major trendline. The most important trendline for July lumber is the one that connects the lows of October 2003 with the correction low in March 2004. Using this line as the trend identifier, we note that July lumber's recent decline stopped just short of intersection in mid-June. |
|
| A new June low could be the prelude to even lower lows in July lumber. |
| Graphic provided by: Prophet Financial Systems, Inc.. |
| |
| Other trend identifiers are less positive. The mid-June declines in July lumber brought prices below both the 20- and 50-day exponential moving averages. The most recent trading action saw July lumber make a test of resistance at a point where the two intermediate moving averages converged in mid-June. As of this writing, resistance is holding and the would-be, mini-rally in lumber has stalled. |
| Adding to the less-positive side of the ledger is the head and shoulders top that appears to have developed in July lumber, starting in early April and topping in early May. The head and shoulders top is a classic topping chart pattern, one that most traders and investors learn to spot relatively early. While this ability to spot head and shoulders patterns--as Heisenberg might say--is probably inversely related to the likelihood of that pattern maturing and experiencing a successful break, the combination of this pattern with other bearish factors makes it a pattern worth watching. |
| The head and shoulders top has a high point of 429.50 and a neckline at about 887.10 (the neckline slopes upward somewhat). Given these measurements, a downside break from the pattern should result in a minimum decline to the 344.70 area over the next month or so. At present, July lumber has broken down to about 376 and rallied up toward the neckline. Should July lumber slip back and take out the low that was formed during the initial break to 376, then more downside should follow swiftly afterward. |
Technical Writer for Technical Analysis of STOCKS & COMMODITIES magazine, Working-Money.com, and Traders.com Advantage.
| Title: | Technical Writer |
| Company: | Technical Analysis, Inc. |
| Address: | 4757 California Avenue SW |
| Seattle, WA 98116 | |
| Phone # for sales: | 206 938 0570 |
| Fax: | 206 938 1307 |
| Website: | www.Traders.com |
| E-mail address: | DPenn@traders.com |
Traders' Resource Links | |
| Charting the Stock Market: The Wyckoff Method -- Books | |
| Working-Money.com -- Online Trading Services | |
| Traders.com Advantage -- Online Trading Services | |
| Technical Analysis of Stocks & Commodities -- Publications and Newsletters | |
| Working Money, at Working-Money.com -- Publications and Newsletters | |
| Traders.com Advantage -- Publications and Newsletters | |
| Professional Traders Starter Kit -- Software | |
Click here for more information about our publications!
Comments

Request Information From Our Sponsors
- StockCharts.com, Inc.
- Candle Patterns
- Candlestick Charting Explained
- Intermarket Technical Analysis
- John Murphy on Chart Analysis
- John Murphy's Chart Pattern Recognition
- John Murphy's Market Message
- MurphyExplainsMarketAnalysis-Intermarket Analysis
- MurphyExplainsMarketAnalysis-Visual Analysis
- StockCharts.com
- Technical Analysis of the Financial Markets
- The Visual Investor
- VectorVest, Inc.
- Executive Premier Workshop
- One-Day Options Course
- OptionsPro
- Retirement Income Workshop
- Sure-Fire Trading Systems (VectorVest, Inc.)
- Trading as a Business Workshop
- VectorVest 7 EOD
- VectorVest 7 RealTime/IntraDay
- VectorVest AutoTester
- VectorVest Educational Services
- VectorVest OnLine
- VectorVest Options Analyzer
- VectorVest ProGraphics v6.0
- VectorVest ProTrader 7
- VectorVest RealTime Derby Tool
- VectorVest Simulator
- VectorVest Variator
- VectorVest Watchdog