HOT TOPICS LIST
- MACD
- Fibonacci
- RSI
- Gann
- ADXR
- Stochastics
- Volume
- Triangles
- Futures
- Cycles
- Volatility
- ZIGZAG
- MESA
- Retracement
- Aroon
INDICATORS LIST
LIST OF TOPICS
PRINT THIS ARTICLE
by Kevin Hopson
Natural gas is entering a critical stage right now, as key support and resistance levels are converging upon one another.
Position: Hold
Kevin Hopson
Kevin has been a technical analyst for roughly 10 years now. Previously, Kevin owned his own business and acted as a registered investment advisor, specializing in energy. He was also a freelance oil analyst for Orient Trading Co., a commodity futures trading firm in Japan. Kevin is currently a freelance writer.
PRINT THIS ARTICLE
TECHNICAL ANALYSIS
The Big Picture For Natural Gas
06/22/04 04:36:29 PMby Kevin Hopson
Natural gas is entering a critical stage right now, as key support and resistance levels are converging upon one another.
Position: Hold
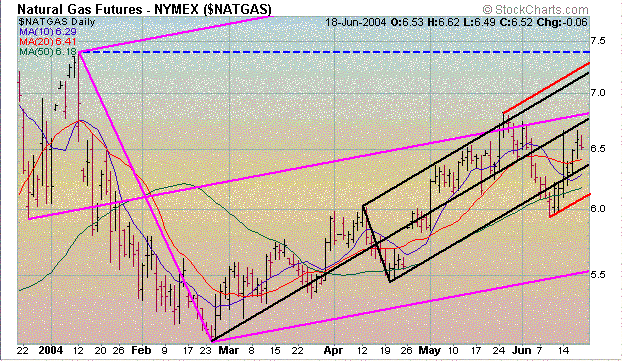
| I have probably touched on natural gas prices more than anything else in the market, as evident by the number of articles I have written on this subject. However, I feel that natural gas is entering a critical juncture right now, which warrants further analysis of this commodity. Let us start by looking at the short-term (six-month) chart for the continuous futures contract. The last time I touched on natural gas prices, I said that the top parallel line of the black pitchfork would likely act as near-term resistance. Though prices broke the 61.8 percent retracement level from the Jan.-Feb. 2004 decline, the top parallel line was only slightly breached. Also, the median line of the large purple pitchfork came into play, adding to resistance in the $6.70 to $6.80 range. As a result, a breakout failed to occur. |
| Since then, prices have proceeded to pull back, with the contract recently breaching support along the lower black parallel line. However, if you have read any of my prior articles that touch on warning lines, you will recall that this break of support was not a sell signal. For example, when the bottom parallel line of a pitchfork is broken, you want to give prices a second chance by drawing a sliding parallel line (or warning line) from the ultimate low. As you can see in the chart, prices found support along the red warning line and failed to give a sell signal by staying above it. If you look at the other warning line (above the top parallel line of the black pitchfork), you will see that this works both ways. If natural gas prices were to move above this warning line, a buy signal would be given. |

|
| Six-month chart for natural gas. |
| Graphic provided by: Stockcharts.com. |
| |
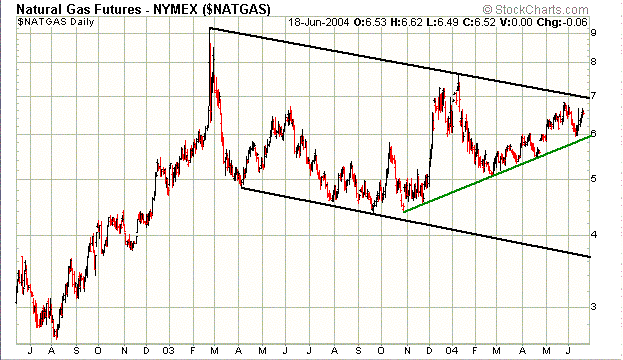
| If you turn your attention to the long-term (two-year) chart, you will not only notice that support and resistance levels are being solidified by different time frames, but you will also notice that two major trendlines are converging upon one another. For example, notice how the contract's long-term uptrend line (green line) from last October's low comes into play around the $6.00 level. This is right below the bottom warning line, which is converging around the $6.10 level. This means that prices should find significant support in the $6.00 to $6.10 range. |
 Long term (two-year) chart for natural gas. On the flip side, the Feb. 2003 downtrend line (or top of the falling channel formation) is coming into play around the $7.00 level, which will likely act as resistance in the near term. In addition, the purple and black median lines are converging around $6.80, while the top black parallel line, top red warning line and the 2004 high all reside in the $7.20 to $7.40 range. In other words, the contract will likely find significant resistance in the $6.80 to $7.40 range. |
| Given the confluence of support around $6.00 and the confluence of resistance around $7.00, natural gas will likely consolidate in this price range before breaking out (up or down). In my opinion, the $6.80 to $7.00 range - the site of the purple median line and the Feb. 2003 downtrend line - is the most significant obstacle to overcome in the near term. Not only would a breach of resistance here reverse the longer-term downtrend, but it would also push prices into the top half of the purple pitchfork. This means that the top purple parallel line - which is currently converging around the $8.10 level - could act as a long-term upside target. In the meantime, I would continue to hold natural gas, as prices have yet to give a sell signal. However, keep a close eye on the support and resistance levels I mentioned, as they will likely dictate which way prices move in the long-term. |
Kevin has been a technical analyst for roughly 10 years now. Previously, Kevin owned his own business and acted as a registered investment advisor, specializing in energy. He was also a freelance oil analyst for Orient Trading Co., a commodity futures trading firm in Japan. Kevin is currently a freelance writer.
| Glen Allen, VA | |
| E-mail address: | hopson_1@yahoo.com |
Click here for more information about our publications!
Comments
Date: 06/22/04Rank: 5Comment:
Date: 06/23/04Rank: 5Comment:
Date: 06/26/04Rank: 4Comment:

Request Information From Our Sponsors
- VectorVest, Inc.
- Executive Premier Workshop
- One-Day Options Course
- OptionsPro
- Retirement Income Workshop
- Sure-Fire Trading Systems (VectorVest, Inc.)
- Trading as a Business Workshop
- VectorVest 7 EOD
- VectorVest 7 RealTime/IntraDay
- VectorVest AutoTester
- VectorVest Educational Services
- VectorVest OnLine
- VectorVest Options Analyzer
- VectorVest ProGraphics v6.0
- VectorVest ProTrader 7
- VectorVest RealTime Derby Tool
- VectorVest Simulator
- VectorVest Variator
- VectorVest Watchdog
- StockCharts.com, Inc.
- Candle Patterns
- Candlestick Charting Explained
- Intermarket Technical Analysis
- John Murphy on Chart Analysis
- John Murphy's Chart Pattern Recognition
- John Murphy's Market Message
- MurphyExplainsMarketAnalysis-Intermarket Analysis
- MurphyExplainsMarketAnalysis-Visual Analysis
- StockCharts.com
- Technical Analysis of the Financial Markets
- The Visual Investor
