HOT TOPICS LIST
- MACD
- Fibonacci
- RSI
- Gann
- ADXR
- Stochastics
- Volume
- Triangles
- Futures
- Cycles
- Volatility
- ZIGZAG
- MESA
- Retracement
- Aroon
INDICATORS LIST
LIST OF TOPICS
PRINT THIS ARTICLE
by Gary Grosschadl
PotashCorp raises second quarter guidance, spurring the share price near the highs of 1998.
Position: Hold
Gary Grosschadl
Independent Canadian equities trader and technical analyst based in Peterborough
Ontario, Canada.
PRINT THIS ARTICLE
CHART ANALYSIS
POT.TO On Fire
06/21/04 03:33:02 PMby Gary Grosschadl
PotashCorp raises second quarter guidance, spurring the share price near the highs of 1998.
Position: Hold
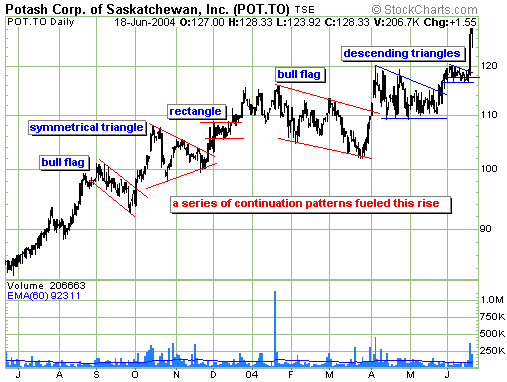
| The daily chart (covering a one year period) shows the exceptional 50% rise this stock has enjoyed. Note the series of continuation patterns that manifested this rise. It is interesting to note the last two patterns took the form of descending triangles. Many technicians perceive descending triangles as predominately bearish formations. This serves as a potent reminder that it is always the break of the pattern that is the best trading signal, no matter which direction. |
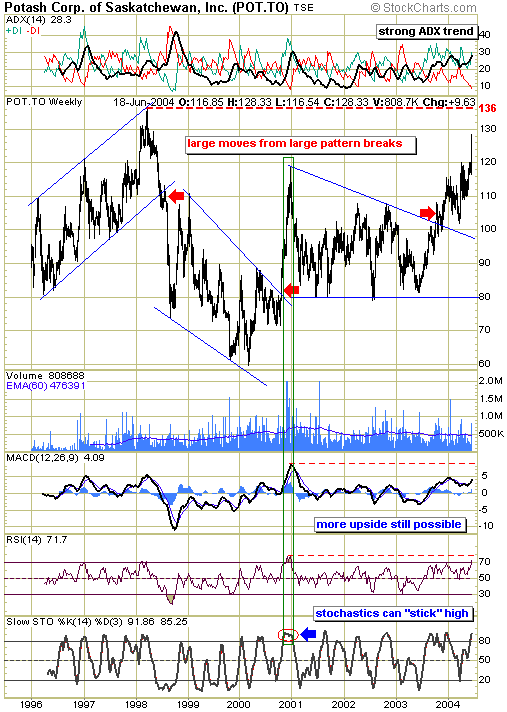
| When trying to surmise how much further this move can go, it is best to take a longer term view via the weekly chart. This weekly chart shows three large patterns: an upwards trending channel, a large falling wedge and finally a break past a descending triangle. Note how a break in each of these patterns resulted in a tradeable move. |

|
| A strong rising trend the past year for Potash Corp. |
| Graphic provided by: stockcharts.com. |
| |
| A possible target for this latest bullish push north is the high of 1998 ~ $136. All the displayed indicators suggest the potential of further upside. The ADX above the chart shows a strong and rising trend. The next two indicators (MACD and RSI) also show a bullish upslope, especially the Relative Strength Index as it breaks above the 70 threshold. The stochastics indicator shows a move into overbought territory (rising above 80) but as seen back in late 2000, stochastics has the potential of "sticking" high for a time being if a strong rising trend is present. |
 A possible testing of 1998 highs may be coming. The next few weeks should show whether or not this stock can reach previous highs and traders should be aware of any trend change or reversal signalling a bout of profit taking. Profit takers could have the stock eventually re-test the $120 eventually, setting up another potential trading opportunity. |
Independent Canadian equities trader and technical analyst based in Peterborough
Ontario, Canada.
| Website: | www.whatsonsale.ca/financial.html |
| E-mail address: | gwg7@sympatico.ca |
Click here for more information about our publications!
Comments

Request Information From Our Sponsors
- StockCharts.com, Inc.
- Candle Patterns
- Candlestick Charting Explained
- Intermarket Technical Analysis
- John Murphy on Chart Analysis
- John Murphy's Chart Pattern Recognition
- John Murphy's Market Message
- MurphyExplainsMarketAnalysis-Intermarket Analysis
- MurphyExplainsMarketAnalysis-Visual Analysis
- StockCharts.com
- Technical Analysis of the Financial Markets
- The Visual Investor
- VectorVest, Inc.
- Executive Premier Workshop
- One-Day Options Course
- OptionsPro
- Retirement Income Workshop
- Sure-Fire Trading Systems (VectorVest, Inc.)
- Trading as a Business Workshop
- VectorVest 7 EOD
- VectorVest 7 RealTime/IntraDay
- VectorVest AutoTester
- VectorVest Educational Services
- VectorVest OnLine
- VectorVest Options Analyzer
- VectorVest ProGraphics v6.0
- VectorVest ProTrader 7
- VectorVest RealTime Derby Tool
- VectorVest Simulator
- VectorVest Variator
- VectorVest Watchdog
