HOT TOPICS LIST
- MACD
- Fibonacci
- RSI
- Gann
- ADXR
- Stochastics
- Volume
- Triangles
- Futures
- Cycles
- Volatility
- ZIGZAG
- MESA
- Retracement
- Aroon
INDICATORS LIST
LIST OF TOPICS
PRINT THIS ARTICLE
by David Penn
In a bull market since the summer of 2002, Legg Mason experiences a major trendline break in the summer of 2004.
Position: N/A
David Penn
Technical Writer for Technical Analysis of STOCKS & COMMODITIES magazine, Working-Money.com, and Traders.com Advantage.
PRINT THIS ARTICLE
TREND-CHANNEL
Legg Mason's Trendline Break
06/18/04 01:16:41 PMby David Penn
In a bull market since the summer of 2002, Legg Mason experiences a major trendline break in the summer of 2004.
Position: N/A
| While a great many stocks fell during the bear market from 2000 to 2002, a number of stocks like Legg Mason (LM) remained resilient. |
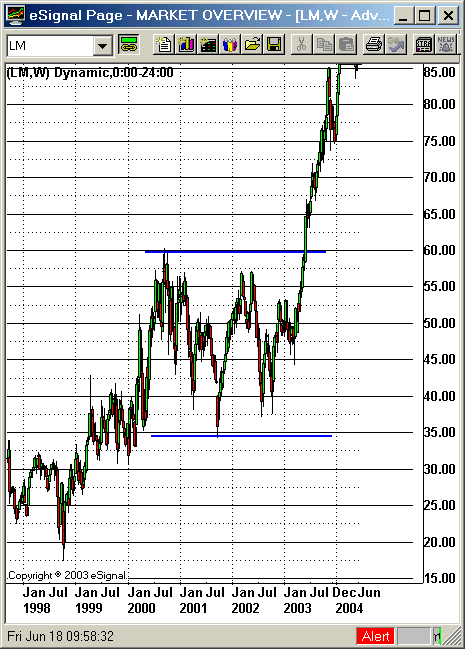
| After reaching a peak of 60 in the fall of 2000, Legg Mason entered a trading range from which it would not emerge until the spring of 2003. At its worst during this period, Legg Mason fell as low as 34.25 -- those lows established during the declines that followed the September 11th terrorist attack. As severe as those declines were (and a 43% decline is nothing to sniff at), they did not take out the pre-peak lows in 2000 of 30.75. |

|
| Figure 1: Legg Mason remained in a 20-odd point range from the beginning of the bear market in 2000 to the bottom in 2002. |
| Graphic provided by: eSignal. |
| |
| Legg Mason broke out of this trading range in the spring of 2003, and was part of the broad-based bull market in stocks that became obvious to all by the summer. From its breakout level of about 60 in May 2003, Legg Mason rallied to 84 by October, and breached 99 by April 2004. This represents a 65% post-breakout gain; a trader or investor who accumulated shares during the trading range/consolidation, of course, would have fared even better. |
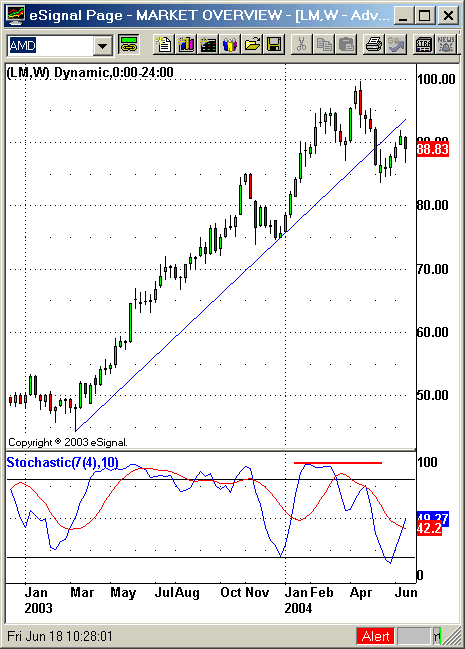
 Figure 2: This trendline break is one of two bearish portents for Legg Mason over the past six months. Nevertheless, it appears as if Legg Mason may be on the verge of its first major post-breakout correction in the summer of 2004. This correction comes in the form of a breakdown below the trendline that connects the March 2003 lows through the correction lows of December of that year to intersect with a price break on May 3, 2004. |
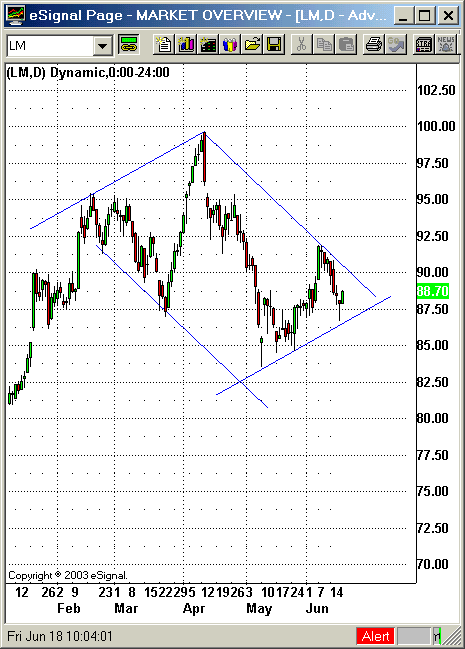
Adding to the bearishness of this trendline break is the negative divergence that has developed between the 7, 10 stochastic oscillator and price action in Legg Mason since the year began. Figure 3: The developing top in Legg Mason may take the form of a diamond pattern. If the trendline break and negative stochastic divergence suggest a top in Legg Mason, then a diamond pattern might be the shape of that top. As Figure 3 shows, two sets of parallel trendlines bound the price action in Legg Mason since, at least, February 2004. If the diamond suggested by these trendlines is accurately reflecting a top, then price action should confirm relatively quickly with a break beneath the lower right trendline. |
Technical Writer for Technical Analysis of STOCKS & COMMODITIES magazine, Working-Money.com, and Traders.com Advantage.
| Title: | Technical Writer |
| Company: | Technical Analysis, Inc. |
| Address: | 4757 California Avenue SW |
| Seattle, WA 98116 | |
| Phone # for sales: | 206 938 0570 |
| Fax: | 206 938 1307 |
| Website: | www.Traders.com |
| E-mail address: | DPenn@traders.com |
Traders' Resource Links | |
| Charting the Stock Market: The Wyckoff Method -- Books | |
| Working-Money.com -- Online Trading Services | |
| Traders.com Advantage -- Online Trading Services | |
| Technical Analysis of Stocks & Commodities -- Publications and Newsletters | |
| Working Money, at Working-Money.com -- Publications and Newsletters | |
| Traders.com Advantage -- Publications and Newsletters | |
| Professional Traders Starter Kit -- Software | |
Click here for more information about our publications!
Comments
Date: 06/21/04Rank: 3Comment:

Request Information From Our Sponsors
- StockCharts.com, Inc.
- Candle Patterns
- Candlestick Charting Explained
- Intermarket Technical Analysis
- John Murphy on Chart Analysis
- John Murphy's Chart Pattern Recognition
- John Murphy's Market Message
- MurphyExplainsMarketAnalysis-Intermarket Analysis
- MurphyExplainsMarketAnalysis-Visual Analysis
- StockCharts.com
- Technical Analysis of the Financial Markets
- The Visual Investor
- VectorVest, Inc.
- Executive Premier Workshop
- One-Day Options Course
- OptionsPro
- Retirement Income Workshop
- Sure-Fire Trading Systems (VectorVest, Inc.)
- Trading as a Business Workshop
- VectorVest 7 EOD
- VectorVest 7 RealTime/IntraDay
- VectorVest AutoTester
- VectorVest Educational Services
- VectorVest OnLine
- VectorVest Options Analyzer
- VectorVest ProGraphics v6.0
- VectorVest ProTrader 7
- VectorVest RealTime Derby Tool
- VectorVest Simulator
- VectorVest Variator
- VectorVest Watchdog
