HOT TOPICS LIST
- MACD
- Fibonacci
- RSI
- Gann
- ADXR
- Stochastics
- Volume
- Triangles
- Futures
- Cycles
- Volatility
- ZIGZAG
- MESA
- Retracement
- Aroon
INDICATORS LIST
LIST OF TOPICS
PRINT THIS ARTICLE
by Han Kim
Which one should you use? Why not both! Determining market direction by using only half the data doesn't make any sense. Use all of it to ensure the highest probability of success.
Position: N/A
Han Kim
Traders.com Advantage Staff Writer
PRINT THIS ARTICLE
VOLUME
Positive Volume Index Or Negative Volume Index?
05/19/00 09:12:29 AMby Han Kim
Which one should you use? Why not both! Determining market direction by using only half the data doesn't make any sense. Use all of it to ensure the highest probability of success.
Position: N/A
| The positive volume index (PVI) measures the trend of the stock prices for days when volume increases from previous day's volume. Conversely, negative volume index (NVI) measures the trend of the stock prices for days when volume decreases from previous day's volume. | ||||||||||||||||||
| These indicators are based on the theory that the "uninformed crowd" trades predominantly on days that the volumes are rising, whereas the "smart money" is trading on the days that the volumes are declining. So the PVI is an indicator for the trend of the uninformed crowd, and NVI is an indicator for the trend of the smart money. Below is an example of how to use PVI and NVI. When these index values are compared to their respective one-year moving averages, buy/sell signals occur. | ||||||||||||||||||

| ||||||||||||||||||
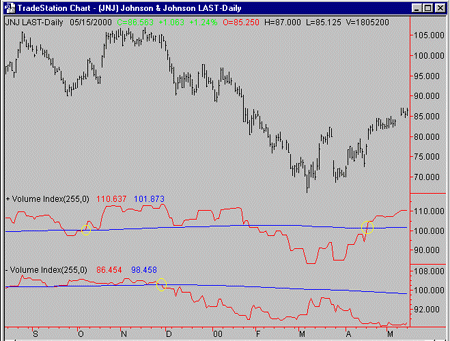
| A bar chart of Johnson & Johnson [JNJ] for the months of August 1999 through May 2000. The positive volume index and negative volume index are shown below the chart. | ||||||||||||||||||
| Graphic provided by: TradeStation. | ||||||||||||||||||
| | ||||||||||||||||||
| Both indicators are calculated by comparing today's volume to the previous day's volume: Starting with a base of 100 for PVI and NVI: TC = Today's close YC = Yesterday's close If today's volume is greater than yesterday's volume: PVI = yesterday's PVI + (((TC - YC) / YC) * yesterday's PVI) NVI = yesterday's NVI If today's volume is less than yesterday's volume: NVI = yesterday's NVI + (((TC - YC) / YC) * yesterday's NVI) PVI = yesterday's PVI If today's volume equals yesterday's volume: PVI = yesterday's PVI NVI = yesterday's NVI | ||||||||||||||||||
| Even though each indicator generates its own buy/sell signals, you can improve the probability of the price moving in a given direction when both signals are in agreement. In October 1999, the PVI crossed above its moving average. During this time the NVI was also above its moving average, generating a buy signal. Then just before December, the NVI went below the moving average, giving a sell signal. Norman Fosback, author of "Stock Market Logic", did a study comparing the PVI and NVI results with actual market performance. Fosback's study showed the high accuracy that these indicators, particuarly the NVI, had in predicting a bull market. For the years 1941 through 1975 he obtained the following results:
| ||||||||||||||||||
| In summary, when both indicators are above their moving averages, it's a buy signal and when the NVI goes below, it's a sell signal. |
Traders.com Advantage Staff Writer
| Title: | Webmaster |
| Company: | Technical Analysis, Inc. |
| Address: | 4757 California AVE SW |
| Seattle, WA 98116 | |
| Phone # for sales: | 206-938-0570 |
| Fax: | 206-938-1307 |
| Website: | www.traders.com |
| E-mail address: | hkim@traders.com |
Traders' Resource Links | |
| Charting the Stock Market: The Wyckoff Method -- Books | |
| Working-Money.com -- Online Trading Services | |
| Traders.com Advantage -- Online Trading Services | |
| Technical Analysis of Stocks & Commodities -- Publications and Newsletters | |
| Working Money, at Working-Money.com -- Publications and Newsletters | |
| Traders.com Advantage -- Publications and Newsletters | |
| Professional Traders Starter Kit -- Software | |
Click here for more information about our publications!
Comments
Date: / /Rank: 4Comment:
Date: / /Rank: 4Comment:
Date: 01/22/02Rank: 4Comment:
Date: 02/15/03Rank: 5Comment:
Date: 04/08/13Rank: 4Comment:

Request Information From Our Sponsors
- StockCharts.com, Inc.
- Candle Patterns
- Candlestick Charting Explained
- Intermarket Technical Analysis
- John Murphy on Chart Analysis
- John Murphy's Chart Pattern Recognition
- John Murphy's Market Message
- MurphyExplainsMarketAnalysis-Intermarket Analysis
- MurphyExplainsMarketAnalysis-Visual Analysis
- StockCharts.com
- Technical Analysis of the Financial Markets
- The Visual Investor
- VectorVest, Inc.
- Executive Premier Workshop
- One-Day Options Course
- OptionsPro
- Retirement Income Workshop
- Sure-Fire Trading Systems (VectorVest, Inc.)
- Trading as a Business Workshop
- VectorVest 7 EOD
- VectorVest 7 RealTime/IntraDay
- VectorVest AutoTester
- VectorVest Educational Services
- VectorVest OnLine
- VectorVest Options Analyzer
- VectorVest ProGraphics v6.0
- VectorVest ProTrader 7
- VectorVest RealTime Derby Tool
- VectorVest Simulator
- VectorVest Variator
- VectorVest Watchdog
