HOT TOPICS LIST
- MACD
- Fibonacci
- RSI
- Gann
- ADXR
- Stochastics
- Volume
- Triangles
- Futures
- Cycles
- Volatility
- ZIGZAG
- MESA
- Retracement
- Aroon
INDICATORS LIST
LIST OF TOPICS
PRINT THIS ARTICLE
by Koos van der Merwe
On June 15th, I presented an article, "New Bull Market. . . Or?" In it, I showed my preferred Elliott Wave count, but every Elliottician has an alternate strategy ready to pull it out at a moment's notice. Here are two of mine.
Position: N/A
Koos van der Merwe
Has been a technical analyst since 1969, and has worked as a futures and options trader with First Financial Futures in Johannesburg, South Africa.
PRINT THIS ARTICLE
ELLIOTT WAVE
Looking At The Sign In The Road. . .
06/18/04 11:49:55 AMby Koos van der Merwe
On June 15th, I presented an article, "New Bull Market. . . Or?" In it, I showed my preferred Elliott Wave count, but every Elliottician has an alternate strategy ready to pull it out at a moment's notice. Here are two of mine.
Position: N/A
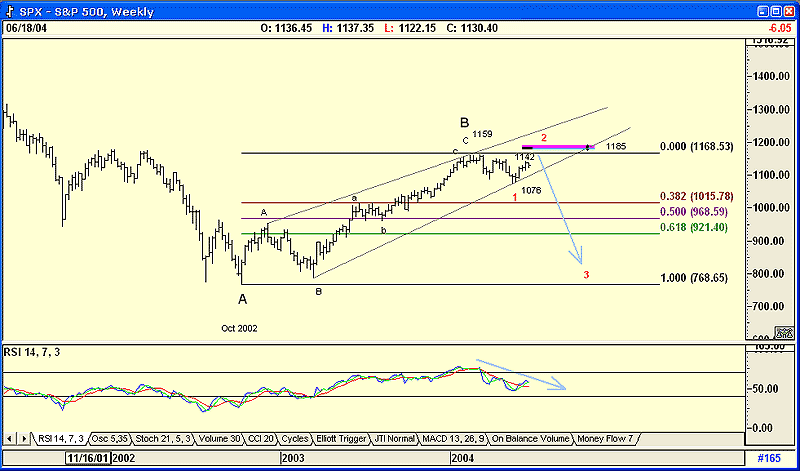
| The alternate weekly chart suggests that the move up, rather than a five wave impulse wave as shown in the weekly chart of June 15th, is an abc count to complete the major B-Wave. This is more in line with a B-Wave setup, which is usually an abc-x-abc count, rather than a 1,2,3,4,5 impulse wave count. If this is indeed so, and the falling RSI indicator and rising wedge formation seem to suggest it is, then the recent fall from the major B-WAVE high of 1159 to 1076 could be wave 1 of the major C-WAVE down. The rise to 1142 and higher, should the index rise to the 1185 level suggested by the MOB (see previous article for the explanation), would then be Wave 2, with wave 3 down to follow as I have shown by the falling arrow. |
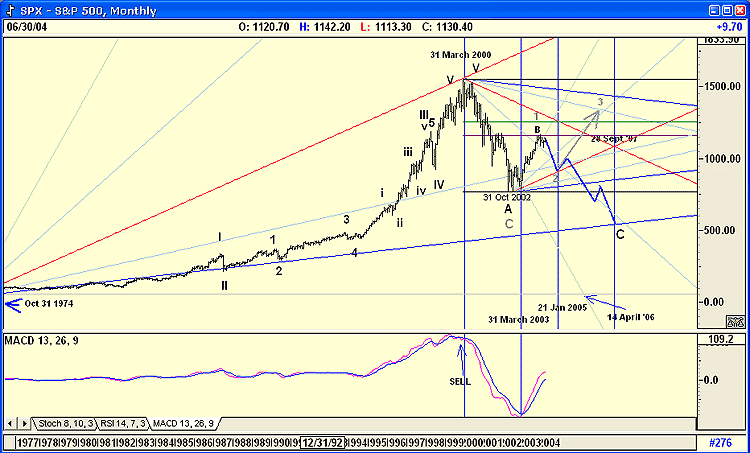
| So the expected rise into June, July, and possibly August, before the collapse will not happen. The alternate count suggests that the bear market has already begun and will continue for the next four to five years. I have shown this alternate count on the monthly chart below. Compare it with the monthly chart in the original article and note the differences. |

|
| Figure 1: Alternate Elliott Wave Count on the S&P 500's weekly chart. |
| Graphic provided by: AdvancedGET. |
| |
 Figure 2: Alternate Elliott Wave count on the monthly chart. |
| Finally, to make things even more interesting and possibly confusing, one can assume that WAVE A is in actual fact WAVE C, highlighted in gray, and that the Index is tracing out the beginnings of a new bull market with major WAVE 1 (gray) completed at the 50% retracement. Any down move would then be WAVE 2. This, however, seems to be an unlikely count, simply because of the following: 1. The time period. With the bull market as shown on the chart starting on October 31, 1974, a period of 26 years, a bear retracement of only two years seems unlikely. Bear markets on average are 38.2% (Fibonacci number) or close to this figure of a major bull run. 2. The MACD oscillator looks as though it is turning down. It has not yet given a sell signal, and could continue to rise in a strong upward move, but at present, it is hinting at weakness. |
| Whichever count is correct, the index looks weak for the short to medium terms, reflecting the uncertainty in the world today. It looks as though it has reached a fork in the road and is trying to decide which way to go, or perhaps it already knows, and is simply teasing us. It is for us to determine and not to guess its intentions, or better yet, err on the side of caution and wait and see. Be careful out there. |
Has been a technical analyst since 1969, and has worked as a futures and options trader with First Financial Futures in Johannesburg, South Africa.
| Address: | 3256 West 24th Ave |
| Vancouver, BC | |
| Phone # for sales: | 6042634214 |
| E-mail address: | petroosp@gmail.com |
Click here for more information about our publications!
Comments
Date: 06/18/04Rank: 5Comment:
Date: 06/20/04Rank: 5Comment:
Date: 06/21/04Rank: 1Comment: please, the least elliot wave analysis the better. bye.

|

Request Information From Our Sponsors
- StockCharts.com, Inc.
- Candle Patterns
- Candlestick Charting Explained
- Intermarket Technical Analysis
- John Murphy on Chart Analysis
- John Murphy's Chart Pattern Recognition
- John Murphy's Market Message
- MurphyExplainsMarketAnalysis-Intermarket Analysis
- MurphyExplainsMarketAnalysis-Visual Analysis
- StockCharts.com
- Technical Analysis of the Financial Markets
- The Visual Investor
- VectorVest, Inc.
- Executive Premier Workshop
- One-Day Options Course
- OptionsPro
- Retirement Income Workshop
- Sure-Fire Trading Systems (VectorVest, Inc.)
- Trading as a Business Workshop
- VectorVest 7 EOD
- VectorVest 7 RealTime/IntraDay
- VectorVest AutoTester
- VectorVest Educational Services
- VectorVest OnLine
- VectorVest Options Analyzer
- VectorVest ProGraphics v6.0
- VectorVest ProTrader 7
- VectorVest RealTime Derby Tool
- VectorVest Simulator
- VectorVest Variator
- VectorVest Watchdog
