HOT TOPICS LIST
- MACD
- Fibonacci
- RSI
- Gann
- ADXR
- Stochastics
- Volume
- Triangles
- Futures
- Cycles
- Volatility
- ZIGZAG
- MESA
- Retracement
- Aroon
INDICATORS LIST
LIST OF TOPICS
PRINT THIS ARTICLE
by Kevin Hopson
As expected, Plains Exploration and Production held support at lower levels but is now running into potential resitance.
Position: Hold
Kevin Hopson
Kevin has been a technical analyst for roughly 10 years now. Previously, Kevin owned his own business and acted as a registered investment advisor, specializing in energy. He was also a freelance oil analyst for Orient Trading Co., a commodity futures trading firm in Japan. Kevin is currently a freelance writer.
PRINT THIS ARTICLE
TECHNICAL ANALYSIS
An Update On Plains Exploration & Production
06/17/04 10:50:51 AMby Kevin Hopson
As expected, Plains Exploration and Production held support at lower levels but is now running into potential resitance.
Position: Hold
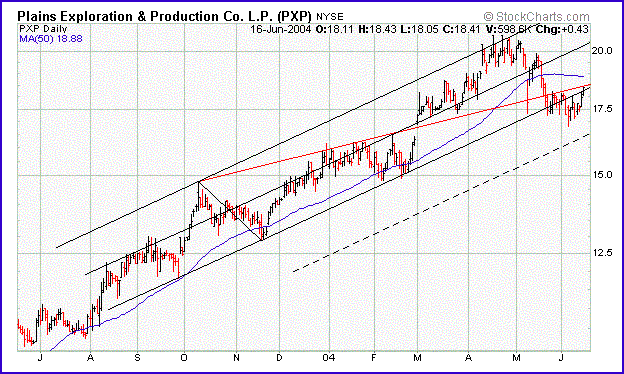
| I touched on Plains Exploration & Production Co. (PXP) just a couple of weeks ago. At that time, I recommended holding shares of Plains despite the deteriorating technicals, the reason being that significant support around the $16.50 level was coming into play. This is the site of the dotted uptrend line and - at the time - the stock's 150-day moving average, which is not shown in the chart. As a result, I only recommended lightening up (selling) if $16.50 was taken out to the downside. |
| As you can see in the one-year chart, this support level held and the stock has proceeded to move higher the last two weeks. However, prices have now moved from a solid support level to a potential area of resistance. The bottom parallel line of the reverse pitchfork (or last September's uptrend line) is currently being tested. This uptrend line - which is now converging around the $18.50 level - acted as ultimate support for over eight months. Since broken support levels tend to act as resistance, as traders who bought prior support are looking to get out, this trendline could act as a barrier in the near-term. |

|
| Graphic provided by: Stockcharts.com. |
| |
| Additionally, notice that another trendline (red line) has converged just above this level. This uptrend line acted as resistance until late February, at which time the stock proceeded to gap above it. However, once this trendline was breached to the downside in May, it turned into resistance again. Because the stock's 50-day moving average ($18.88) is hovering just overhead, Plains looks to have significant resistance in the $18.50 to $19.00 range. If Plains can break resistance here, the stock could eventually make its way up to the $20.50 level, the site of the black median line. In the meantime, I would continue to hold and await further developments. |
Kevin has been a technical analyst for roughly 10 years now. Previously, Kevin owned his own business and acted as a registered investment advisor, specializing in energy. He was also a freelance oil analyst for Orient Trading Co., a commodity futures trading firm in Japan. Kevin is currently a freelance writer.
| Glen Allen, VA | |
| E-mail address: | hopson_1@yahoo.com |
Click here for more information about our publications!
Comments
Date: 06/21/04Rank: 2Comment: a bearish outlook with a hold recommendation (?)
very strange.

|

Request Information From Our Sponsors
- VectorVest, Inc.
- Executive Premier Workshop
- One-Day Options Course
- OptionsPro
- Retirement Income Workshop
- Sure-Fire Trading Systems (VectorVest, Inc.)
- Trading as a Business Workshop
- VectorVest 7 EOD
- VectorVest 7 RealTime/IntraDay
- VectorVest AutoTester
- VectorVest Educational Services
- VectorVest OnLine
- VectorVest Options Analyzer
- VectorVest ProGraphics v6.0
- VectorVest ProTrader 7
- VectorVest RealTime Derby Tool
- VectorVest Simulator
- VectorVest Variator
- VectorVest Watchdog
- StockCharts.com, Inc.
- Candle Patterns
- Candlestick Charting Explained
- Intermarket Technical Analysis
- John Murphy on Chart Analysis
- John Murphy's Chart Pattern Recognition
- John Murphy's Market Message
- MurphyExplainsMarketAnalysis-Intermarket Analysis
- MurphyExplainsMarketAnalysis-Visual Analysis
- StockCharts.com
- Technical Analysis of the Financial Markets
- The Visual Investor
