HOT TOPICS LIST
- MACD
- Fibonacci
- RSI
- Gann
- ADXR
- Stochastics
- Volume
- Triangles
- Futures
- Cycles
- Volatility
- ZIGZAG
- MESA
- Retracement
- Aroon
INDICATORS LIST
LIST OF TOPICS
PRINT THIS ARTICLE
by Kevin Hopson
Transocean has been stuck in a downtrend the last three months but there are signs of a forthcoming reversal.
Position: Accumulate
Kevin Hopson
Kevin has been a technical analyst for roughly 10 years now. Previously, Kevin owned his own business and acted as a registered investment advisor, specializing in energy. He was also a freelance oil analyst for Orient Trading Co., a commodity futures trading firm in Japan. Kevin is currently a freelance writer.
PRINT THIS ARTICLE
CHANNEL LINES
Transocean's Falling Channel Formation
06/17/04 01:20:32 PMby Kevin Hopson
Transocean has been stuck in a downtrend the last three months but there are signs of a forthcoming reversal.
Position: Accumulate
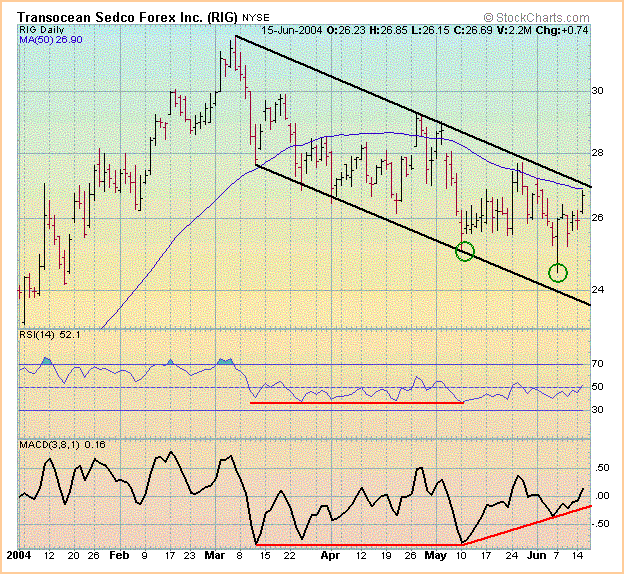
| Transocean Inc. (RIG) has found itself in a falling channel formation since early March, as illustrated by the black trendlines. But recently the stock has been showing signs of strength that should eventually lead to a break of March's downtrend line. |
| Both the relative strength index (RSI) and moving average convergence/divergence (MACD) traded sideways during the March-April period as the stock price continued to decline. Then in the past month, the MACD started putting in higher lows despite the fact that Transocean has been moving lower. This pattern is called a bullish divergence, which normally indicates a forthcoming bottom (or reversal) in the stock price. As you can see in the six-month chart, Transocean needs to break key resistance around the $27.00 level for the downtrend to reverse. Not only is this the site of the stock's 50-day moving average ($26.90), but it is also the site of the top channel line (or March's downtrend line). Given the bullish patterns on the daily chart, I believe it is just a matter of time before a reversal occurs. |

|
| Graphic provided by: Stockcharts.com. |
| |
| Also supporting my theory is current market sentiment towards the stock. Short interest was 13.6M shares as of May 10, which is roughly 5.0x the stock's average daily volume. Additionally, Transocean's put/call open interest ratio for the front three months is at its highest level in a year, while 59 percent of the analysts covering the company currently have a hold or sell rating on the stock. Building pessimism during a downtrend usually signals a forthcoming reversal in the stock price. As a result, I would look to accumulate shares of Transocean in anticipation of higher prices down the road. |
Kevin has been a technical analyst for roughly 10 years now. Previously, Kevin owned his own business and acted as a registered investment advisor, specializing in energy. He was also a freelance oil analyst for Orient Trading Co., a commodity futures trading firm in Japan. Kevin is currently a freelance writer.
| Glen Allen, VA | |
| E-mail address: | hopson_1@yahoo.com |
Click here for more information about our publications!
Comments
Date: 06/21/04Rank: 2Comment:

Request Information From Our Sponsors
- StockCharts.com, Inc.
- Candle Patterns
- Candlestick Charting Explained
- Intermarket Technical Analysis
- John Murphy on Chart Analysis
- John Murphy's Chart Pattern Recognition
- John Murphy's Market Message
- MurphyExplainsMarketAnalysis-Intermarket Analysis
- MurphyExplainsMarketAnalysis-Visual Analysis
- StockCharts.com
- Technical Analysis of the Financial Markets
- The Visual Investor
- VectorVest, Inc.
- Executive Premier Workshop
- One-Day Options Course
- OptionsPro
- Retirement Income Workshop
- Sure-Fire Trading Systems (VectorVest, Inc.)
- Trading as a Business Workshop
- VectorVest 7 EOD
- VectorVest 7 RealTime/IntraDay
- VectorVest AutoTester
- VectorVest Educational Services
- VectorVest OnLine
- VectorVest Options Analyzer
- VectorVest ProGraphics v6.0
- VectorVest ProTrader 7
- VectorVest RealTime Derby Tool
- VectorVest Simulator
- VectorVest Variator
- VectorVest Watchdog
