HOT TOPICS LIST
- MACD
- Fibonacci
- RSI
- Gann
- ADXR
- Stochastics
- Volume
- Triangles
- Futures
- Cycles
- Volatility
- ZIGZAG
- MESA
- Retracement
- Aroon
INDICATORS LIST
LIST OF TOPICS
PRINT THIS ARTICLE
by Koos van der Merwe
The market, as shown by the S&P 500 index, appears to be entering a new Bull market - or is this a sucker play? You decide. Here are the clues.
Position: N/A
Koos van der Merwe
Has been a technical analyst since 1969, and has worked as a futures and options trader with First Financial Futures in Johannesburg, South Africa.
PRINT THIS ARTICLE
ELLIOTT WAVE
New Bull Market. . . Or?
06/15/04 01:37:24 PMby Koos van der Merwe
The market, as shown by the S&P 500 index, appears to be entering a new Bull market - or is this a sucker play? You decide. Here are the clues.
Position: N/A
| I'm starting with a weekly chart. A daily chart is used to find an entry/exit point, whereas a weekly/monthly chart defines an overall trend. |

|
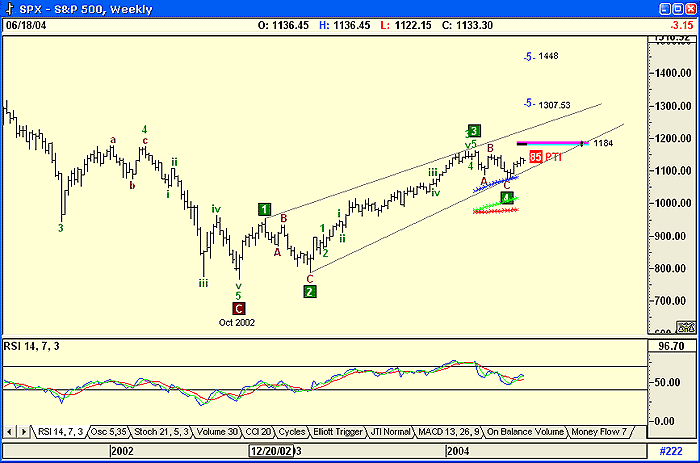
| Figure 1: A last gasp for the S&P 500 index? |
| Graphic provided by: AdvancedGET. |
| |
| The above weekly chart by Advanced GET, highlights my preferred Elliott Wave count. It suggests that the down move from 2000 completed a C-Wave in October 2002, and the subsequent trend is a 5-wave impulse pattern upwards. The chart also suggests that the S&P 500 index is completing a fourth wave and moving into wave five. The suggested target determined by the program is 1307.53. This is a 15% rise, which is reasonably substantial. The GET program also suggests there is an 85% probability this target can be reached, and that the index could go as high as 1448. With the PTI at 85%, this is very likely. Looking at the indicators, the RSI is moving down, suggesting weakness. This is confirmed by the support and resistance lines which suggest a rising wedge formation. Price tends to break downwards from a rising wedge. These two factors alone make the target prices of 1307 and 1488 suspect. Because of this uncertainty I have added the Make or Break (MOB) study of the program to the chart. The MOB (Make or Break) study is a tool that can help you find the target price area for the end of an Elliott Wave 5, or for any pattern that has an impulse-correction-impulse pattern. The MOB target is only 1184, suggesting the 5th wave could be a flat. This seems to fit in with the rising wedge and falling RSI. So. . . is this the start of a new bull market, or. . . is this a bull trap? |
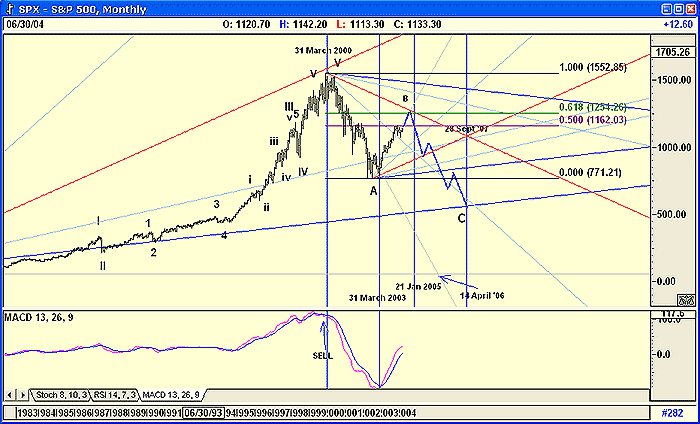
 Figure 2: Monthly chart of the S&P 500. The monthly chart is showing a very different scenario. Here, the S&P 500 index is in a rising B-wave, while the rise shown in the weekly chart is a five impulse wave in a major B-Wave upwards. B-Wave are notorious bull traps, and as the fifth wave shown in the weekly chart unfolds, many could be trapped in the rising bullish enthusiasm. On September 30, 2003, I presented an article, "The S&P 500 And Its Lines," which will explain the Gann fans on the chart. I have added the major Fibonocci retracements to the chart, showing that the Index has retraced to the 50% level and could rise to the 61.8% level should it break above the resistance at 1162. With this in mind I have drawn (blue lines) a possible future scenario. |
| Caution prevails, and the weekly chart is indicating the investing community dislikes the uncertainty prevalent in the world at the moment. Be careful out there. |
Has been a technical analyst since 1969, and has worked as a futures and options trader with First Financial Futures in Johannesburg, South Africa.
| Address: | 3256 West 24th Ave |
| Vancouver, BC | |
| Phone # for sales: | 6042634214 |
| E-mail address: | petroosp@gmail.com |
Click here for more information about our publications!
Comments
Date: 06/15/04Rank: 5Comment:
Date: 06/15/04Rank: 4Comment:
Date: 06/16/04Rank: 3Comment:
Date: 06/18/04Rank: 5Comment: Thanks another great article
JF
Date: 06/22/04Rank: 4Comment:
Date: 07/07/04Rank: 5Comment:

|

Request Information From Our Sponsors
- VectorVest, Inc.
- Executive Premier Workshop
- One-Day Options Course
- OptionsPro
- Retirement Income Workshop
- Sure-Fire Trading Systems (VectorVest, Inc.)
- Trading as a Business Workshop
- VectorVest 7 EOD
- VectorVest 7 RealTime/IntraDay
- VectorVest AutoTester
- VectorVest Educational Services
- VectorVest OnLine
- VectorVest Options Analyzer
- VectorVest ProGraphics v6.0
- VectorVest ProTrader 7
- VectorVest RealTime Derby Tool
- VectorVest Simulator
- VectorVest Variator
- VectorVest Watchdog
- StockCharts.com, Inc.
- Candle Patterns
- Candlestick Charting Explained
- Intermarket Technical Analysis
- John Murphy on Chart Analysis
- John Murphy's Chart Pattern Recognition
- John Murphy's Market Message
- MurphyExplainsMarketAnalysis-Intermarket Analysis
- MurphyExplainsMarketAnalysis-Visual Analysis
- StockCharts.com
- Technical Analysis of the Financial Markets
- The Visual Investor
