HOT TOPICS LIST
- MACD
- Fibonacci
- RSI
- Gann
- ADXR
- Stochastics
- Volume
- Triangles
- Futures
- Cycles
- Volatility
- ZIGZAG
- MESA
- Retracement
- Aroon
INDICATORS LIST
LIST OF TOPICS
PRINT THIS ARTICLE
by Steven Coffey
After a four month downtrend, Charles Schwab (SCH) had a high volume day which seems to have gotten rid of the final sellers. Now it may be ready to start moving up again.
Position: N/A
Steven Coffey
Steven Coffey is an independent stock trader with a background in Information Systems development and training. He resides in the Boston area.
PRINT THIS ARTICLE
REVERSAL
Charles Schwab Bottoming Out Near Shakeout Day
06/14/04 09:43:00 AMby Steven Coffey
After a four month downtrend, Charles Schwab (SCH) had a high volume day which seems to have gotten rid of the final sellers. Now it may be ready to start moving up again.
Position: N/A
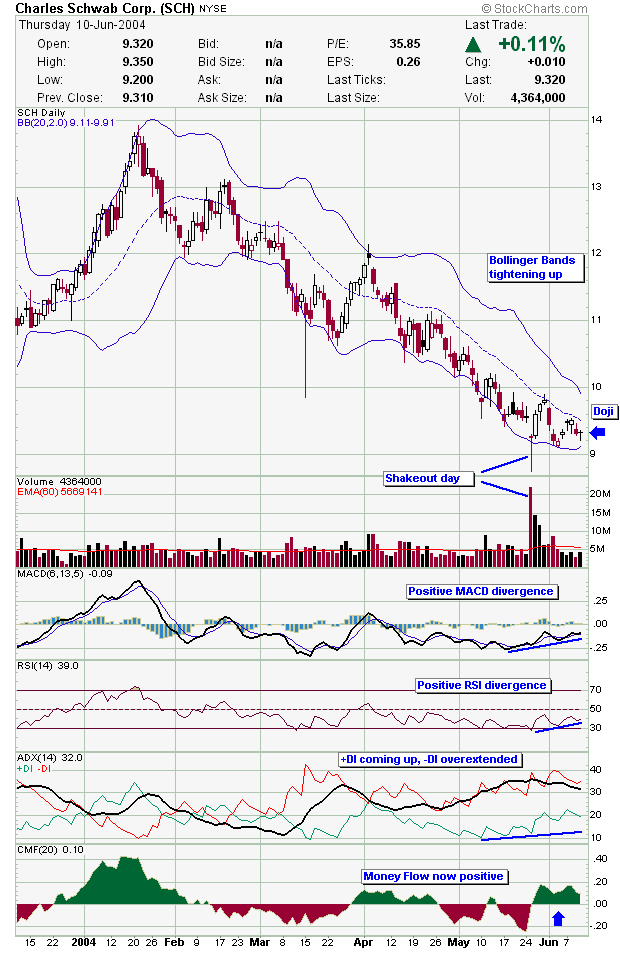
| As the old saying goes, nothing lasts forever, and that applies to a downtrend. Oftentimes what happens at the end of a downtrend is that there will a day when there's a noticeable increase in trading activity that, in effect, "shakes out" the last of the sellers. Once all the sellers are out of the market, supply dries up and those who want to buy have to start raising their bids. Late last month, SCH experienced an extremely high volume day that saw the price gap down 30 cents to $9.25, continue downward to $8.75, and end up closing at $9.27. Since then, it has fluctuated in that general area, and on Friday closed at $9.32. The downtrend appears to be over. |
| Also, Friday itself saw a slight increase in volume as this stock made a five day low, but closed right at its open. This is known as a doji formation, and it signifies a reversal of this short-term downtrend. Another positive is that the Bollinger Bands, shown on the chart, are tightening up. The bottom band is starting to come up, while the top band is still coming down. This pattern indicates that the volatility of the four-month downtrend is slowing down, another sign that this downtrend is over. When the volatility starts picking up again, it should be from upward movement in price. |

|
| Figure 1: Daily chart of Charles Schwab. |
| Graphic provided by: Stockcharts.com. |
| |
| The momentum indicators are also starting to come up. Since the price hasn't turned up yet, these indicators are displaying what's known as a positive momentum divergence. The theory behind this is that momentum has a tendency to lead price. As such, when we see price making new lows, but the momentum oscillators are making higher lows, we can expect price to follow the momentum and start coming up with it. The MACD, RSI, and +DI in the ADX indicator window are all displaying this divergence phenomenon. Also in the ADX window, the -DI, which indicates the force of the downmoves, has become overextended. This leads me to believe that the downtrend has become exhausted, another reason for optimism in Charles Schwab. Finally, the Chaikin money flow indicator went positive right after the shakeout day last month. This shows that the balance between buyers and sellers has shifted toward buying pressure. |
| Between the shakeout day last month, the tightening Bollinger Bands, and the momentum oscillators moving up, I believe this stock has bottomed out and will start coming up soon. Look for short-term resistance at the 50-day moving average, which as of Friday was $10.28. If you can buy this stock for maybe $9.20 or $9.25, that would substantially improve the risk/reward ratio on this trade. |
Steven Coffey is an independent stock trader with a background in Information Systems development and training. He resides in the Boston area.
| E-mail address: | stevencoffey@yahoo.com |
Click here for more information about our publications!
Comments
Date: 06/21/04Rank: 3Comment:

|

Request Information From Our Sponsors
- StockCharts.com, Inc.
- Candle Patterns
- Candlestick Charting Explained
- Intermarket Technical Analysis
- John Murphy on Chart Analysis
- John Murphy's Chart Pattern Recognition
- John Murphy's Market Message
- MurphyExplainsMarketAnalysis-Intermarket Analysis
- MurphyExplainsMarketAnalysis-Visual Analysis
- StockCharts.com
- Technical Analysis of the Financial Markets
- The Visual Investor
- VectorVest, Inc.
- Executive Premier Workshop
- One-Day Options Course
- OptionsPro
- Retirement Income Workshop
- Sure-Fire Trading Systems (VectorVest, Inc.)
- Trading as a Business Workshop
- VectorVest 7 EOD
- VectorVest 7 RealTime/IntraDay
- VectorVest AutoTester
- VectorVest Educational Services
- VectorVest OnLine
- VectorVest Options Analyzer
- VectorVest ProGraphics v6.0
- VectorVest ProTrader 7
- VectorVest RealTime Derby Tool
- VectorVest Simulator
- VectorVest Variator
- VectorVest Watchdog
