HOT TOPICS LIST
- MACD
- Fibonacci
- RSI
- Gann
- ADXR
- Stochastics
- Volume
- Triangles
- Futures
- Cycles
- Volatility
- ZIGZAG
- MESA
- Retracement
- Aroon
INDICATORS LIST
LIST OF TOPICS
PRINT THIS ARTICLE
by Jayanthi Gopalakrishnan
Trendlines act as support and resistance levels in trending markets. They can be effectively utilized to determine entry and exit points.
Position: N/A
Jayanthi Gopalakrishnan
PRINT THIS ARTICLE
Trendlines
05/16/00 10:57:06 AMby Jayanthi Gopalakrishnan
Trendlines act as support and resistance levels in trending markets. They can be effectively utilized to determine entry and exit points.
Position: N/A
| A trendline is a straight line that joins either the tops or bottoms on a price chart. In an uptrend they are drawn through the price bottoms and act as a support level. During a downtrend, a trendline is drawn by connecting the price tops. In this case they act as a resistance level. A break in the trendline indicates a slowdown of the trend or a reversal. |
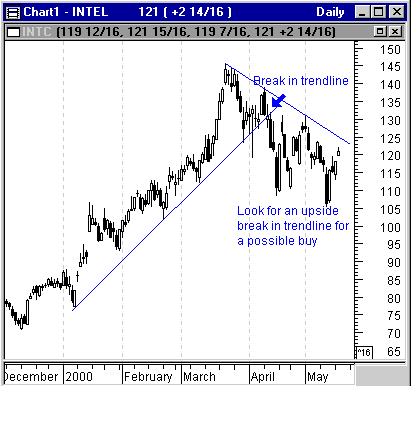
| An example of how to utilize them can be seen in the chart of Intel Corp. [INTC]. Here you see an upward and downward sloping trendline. Notice a break in the upward sloping trendline on April 11, 2000, after which you can see a trend reversal. This break would have been an ideal point to exit your long positions in this stock. |

|
| An upward and downward sloping trendline can be seen in this chart of Intel Corp. [INTC]. A break in the trendline indicates a slowing or reversal of the existing trend. |
| Graphic provided by: Window. |
| |
| The stock is presently in a downward trend and it is a matter of waiting for a break in this downward sloping trend before entering a long position. However, if you notice resistance at this trendline, then this would be an ideal point to short the stock. To protect your losses, place a stop half a point above the trendline. |
| Title: | Editor |
| Company: | Technical Analysis of Stocks & Commodities |
| Address: | 4757 California Ave SW |
| Seattle, WA 98116 | |
| Website: | Traders.com |
| E-mail address: | Jayanthi@traders.com |
Traders' Resource Links | |
| Charting the Stock Market: The Wyckoff Method -- Books | |
| Working-Money.com -- Online Trading Services | |
| Traders.com Advantage -- Online Trading Services | |
| Technical Analysis of Stocks & Commodities -- Publications and Newsletters | |
| Working Money, at Working-Money.com -- Publications and Newsletters | |
| Traders.com Advantage -- Publications and Newsletters | |
| Professional Traders Starter Kit -- Software | |
Click here for more information about our publications!
Comments

Request Information From Our Sponsors
- VectorVest, Inc.
- Executive Premier Workshop
- One-Day Options Course
- OptionsPro
- Retirement Income Workshop
- Sure-Fire Trading Systems (VectorVest, Inc.)
- Trading as a Business Workshop
- VectorVest 7 EOD
- VectorVest 7 RealTime/IntraDay
- VectorVest AutoTester
- VectorVest Educational Services
- VectorVest OnLine
- VectorVest Options Analyzer
- VectorVest ProGraphics v6.0
- VectorVest ProTrader 7
- VectorVest RealTime Derby Tool
- VectorVest Simulator
- VectorVest Variator
- VectorVest Watchdog
- StockCharts.com, Inc.
- Candle Patterns
- Candlestick Charting Explained
- Intermarket Technical Analysis
- John Murphy on Chart Analysis
- John Murphy's Chart Pattern Recognition
- John Murphy's Market Message
- MurphyExplainsMarketAnalysis-Intermarket Analysis
- MurphyExplainsMarketAnalysis-Visual Analysis
- StockCharts.com
- Technical Analysis of the Financial Markets
- The Visual Investor
