HOT TOPICS LIST
- MACD
- Fibonacci
- RSI
- Gann
- ADXR
- Stochastics
- Volume
- Triangles
- Futures
- Cycles
- Volatility
- ZIGZAG
- MESA
- Retracement
- Aroon
INDICATORS LIST
LIST OF TOPICS
PRINT THIS ARTICLE
by Ashwani Gujral
Stocks moving in strong uptrends correct sideways when the overall market corrects, and they continue their uptrends once the markets start rallying again. Synaptics (SYNA) has consolidated while the markets corrected and now may be ready to move up.
Position: N/A
Ashwani Gujral
He is founder of AGIP Securities Pvt. Ltd. which offers money management services, live chat rooms (during market hours) and independent technical analysis consultancy. The company has a big media presence from the likes of CNBC, NDTV Profit, and ZEE Business.
PRINT THIS ARTICLE
CONSOLID FORMATION
Synaptics Consolidates For The Next Upmove
06/11/04 01:01:42 PMby Ashwani Gujral
Stocks moving in strong uptrends correct sideways when the overall market corrects, and they continue their uptrends once the markets start rallying again. Synaptics (SYNA) has consolidated while the markets corrected and now may be ready to move up.
Position: N/A
| Consolidations are periods of rest in trends where the gains or losses of the previous move are digested by the stock. These are also periods when investors and traders can get out of a particular stock, and new traders and investors enter. These consolidations also point to the strength of the underlying trend and serve as a useful barometer for traders to judge the strength of a stock. In most cases consolidations tend to occur in the middle of moves and a move equal in proportion to the move before the consolidation pattern will occur afterwards. Traders should wait to enter consolidation patterns only when they break out, thus confirming the consolidation. It is only clear in hindsight whether the sideways movement is a consolidation and going to continue in the direction of the previous trend, or a topping/bottoming pattern that will result in a reversal. Of course, traders should keep an eye on the overall market, sector, volume and breadth data to judge to future direction of the stock. |

|
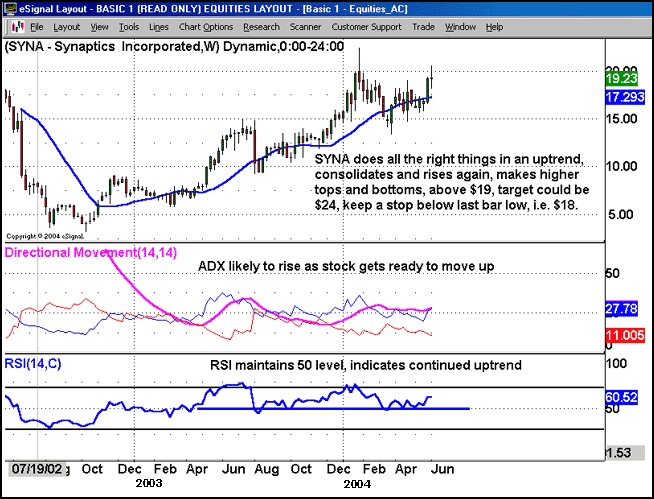
| Figure 1: Weekly chart of Synaptics. |
| Graphic provided by: eSignal. |
| |
| On the weekly chart, Synaptics shows a healthy uptrend--higher tops and bottoms. It has been correcting sideways as the market corrected, and has held on to most of its gains. It also held on to the 20-period moving average, which is a good barometer to determine the current trend of the stock. If this average is consistently moving up, buying can be done every time the stock corrects to this average. Meanwhile, the ADX maintained a healthy level over 20, indicating continued trend strength, and it is likely to move up as the trend gains strength. The weekly RSI maintained the 50 level throughout the correction, indicating the stock was not part of the market's intermediate downtrend. As it can be assumed that the consolidation occurred in the middle of the trend, a target of about $24-$25 is possible. |
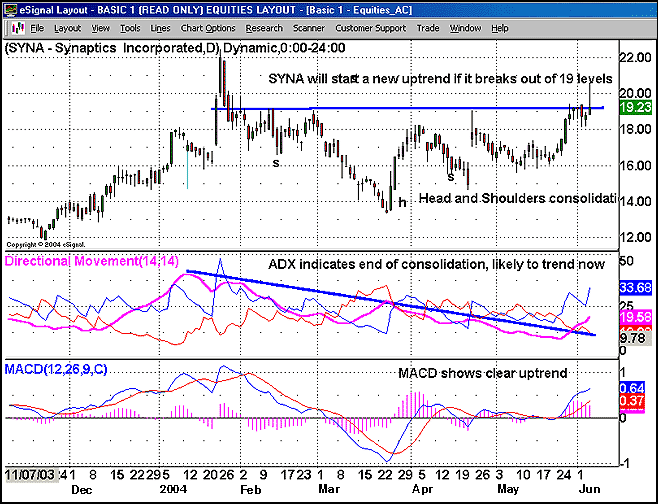
 Figure 2: Daily chart of Synaptics. On the daily chart, Synaptics shows a head and shoulders consolidation pattern that formed over the last four months. A breakout from this consolidation is likely to lead to a move equal in magnitude to the move before this pattern. Note that the stock has started making higher bottoms before the market, showing additional strength. The ADX, which showed a decline in the last four months, has again started rising from its downward sloping trendline, indicating an increase in the strength of the trend. The MACD signals now become valid as the ADX rises to indicate trend strength, and makes a new high relative to previous tops. |
| Synaptics hence becomes a stock that traders should be watching. But the final buy signal comes only on a high volume breakout and if the stock sustains above the neckline of the head and shoulders consolidation pattern. |
He is founder of AGIP Securities Pvt. Ltd. which offers money management services, live chat rooms (during market hours) and independent technical analysis consultancy. The company has a big media presence from the likes of CNBC, NDTV Profit, and ZEE Business.
| Title: | Chief mkt strategist |
| Company: | AGIP Securities |
| India | |
| Phone # for sales: | 9871066337 |
| Website: | www.ashwanigujral.com |
| E-mail address: | contact@ashwanigujral.com |
Traders' Resource Links | |
| AGIP Securities has not added any product or service information to TRADERS' RESOURCE. | |
Click here for more information about our publications!
PRINT THIS ARTICLE

|

Request Information From Our Sponsors
- StockCharts.com, Inc.
- Candle Patterns
- Candlestick Charting Explained
- Intermarket Technical Analysis
- John Murphy on Chart Analysis
- John Murphy's Chart Pattern Recognition
- John Murphy's Market Message
- MurphyExplainsMarketAnalysis-Intermarket Analysis
- MurphyExplainsMarketAnalysis-Visual Analysis
- StockCharts.com
- Technical Analysis of the Financial Markets
- The Visual Investor
- VectorVest, Inc.
- Executive Premier Workshop
- One-Day Options Course
- OptionsPro
- Retirement Income Workshop
- Sure-Fire Trading Systems (VectorVest, Inc.)
- Trading as a Business Workshop
- VectorVest 7 EOD
- VectorVest 7 RealTime/IntraDay
- VectorVest AutoTester
- VectorVest Educational Services
- VectorVest OnLine
- VectorVest Options Analyzer
- VectorVest ProGraphics v6.0
- VectorVest ProTrader 7
- VectorVest RealTime Derby Tool
- VectorVest Simulator
- VectorVest Variator
- VectorVest Watchdog
