HOT TOPICS LIST
- MACD
- Fibonacci
- RSI
- Gann
- ADXR
- Stochastics
- Volume
- Triangles
- Futures
- Cycles
- Volatility
- ZIGZAG
- MESA
- Retracement
- Aroon
INDICATORS LIST
LIST OF TOPICS
PRINT THIS ARTICLE
by Ashwani Gujral
Markets often go into sideways trading channels when there are no big triggers to take the market up or down. This seems to have happened with the S&P 500 in the last four months, but it may have finally broken out of the channel.
Position: N/A
Ashwani Gujral
He is founder of AGIP Securities Pvt. Ltd. which offers money management services, live chat rooms (during market hours) and independent technical analysis consultancy. The company has a big media presence from the likes of CNBC, NDTV Profit, and ZEE Business.
PRINT THIS ARTICLE
CONSOLID FORMATION
S&P 500 May Be Ending Its Sideways Phase
06/14/04 09:50:43 AMby Ashwani Gujral
Markets often go into sideways trading channels when there are no big triggers to take the market up or down. This seems to have happened with the S&P 500 in the last four months, but it may have finally broken out of the channel.
Position: N/A
| Markets and economies often go through periods where a vacuum of news, or the positive news balancing out the negative, leads large institutions to back off trading until there is more clarity. Then the field is left open to traders and shorter term players. These short-term players are then able to move the markets between small ranges, playing for small gains or losses. This can go on for months and can be painful for all but the very nimble traders. Often the best strategy here is to sell straddles and let the premiums erode. |
| As the market moves in a range, the breakout out from these channels can be quite explosive and often occurs only when something triggers the market and strong buying or selling takes it beyond immediate resistances and supports. At this point the key is to avoid false breakouts. While nobody can predict future market movement with certainty, a health check on the market's volume and breadth often proves useful. The market should break out or break down on heavy volume and good positive or negative breadth. |

|
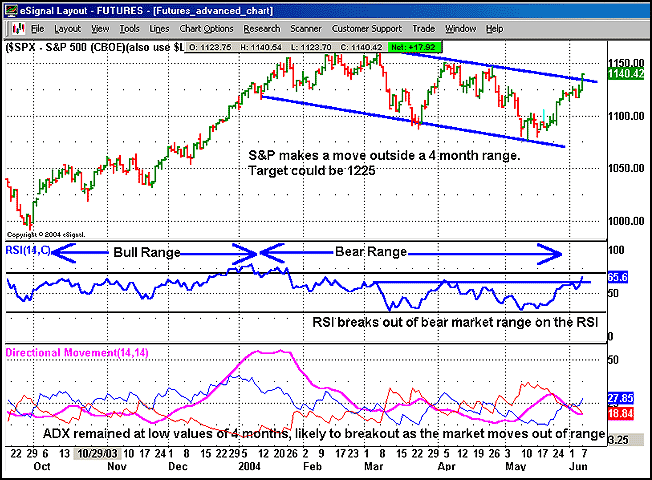
| Figure 1: Daily chart of the $SPX. |
| Graphic provided by: eSignal. |
| |
| On the daily chart, the S&P 500 has just broken through the upper boundary of the channel. Remember that the S&P needs to sustain outside the channel for a couple of sessions before a confirmed breakout is generated, and should be accompanied by large volumes and positive market breadth. Meanwhile, the RSI has broken upwards from the 60 levels, indicating an intermediate bear market in the S&P may be coming to an end. Generally, during pullback rallies in bear markets, the RSI retreats to a level of 60. The ADX has been at low values for the last several months. It would need to rise to indicate a trending move. If the channel can be assumed to have occurred in the middle of the move, it is likely the S&P will reach 1225. The measurement of the move prior to the channel is taken (1175 - 1040 = 135) and added to the bottom of the channel at 1075. |
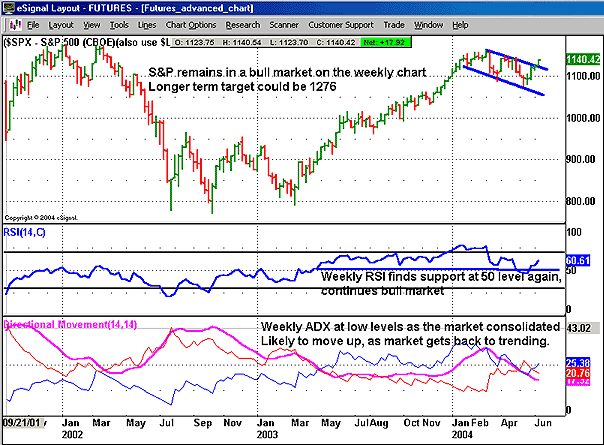
 Figure 2: Weekly chart of the $SPX. On the weekly channel, the S&P 500's four month correction appears as a sideways consolidation and the S&P has held most of it gains of the previous rally. The RSI has found support at the 50 level, indicating that all through the last four months the S&P 500 remained in a bull market. The ADX declined over the past four months, indicating consolidation. It should move up again as this consolidation comes to an end. As market indexes seem to be heading back into a weekly uptrend, traders and investors should identify strong stocks and position themselves for a good upmove. |
| To summarize, markets can move in ranges for months, but the breakout from these ranges often give large tradable moves. The key for traders is to keep their losses down during these tough trading situations. |
He is founder of AGIP Securities Pvt. Ltd. which offers money management services, live chat rooms (during market hours) and independent technical analysis consultancy. The company has a big media presence from the likes of CNBC, NDTV Profit, and ZEE Business.
| Title: | Chief mkt strategist |
| Company: | AGIP Securities |
| India | |
| Phone # for sales: | 9871066337 |
| Website: | www.ashwanigujral.com |
| E-mail address: | contact@ashwanigujral.com |
Traders' Resource Links | |
| AGIP Securities has not added any product or service information to TRADERS' RESOURCE. | |
Click here for more information about our publications!
Comments
Date: 06/15/04Rank: 2Comment:
Date: 06/15/04Rank: 4Comment:
Date: 06/16/04Rank: 5Comment:

|

Request Information From Our Sponsors
- StockCharts.com, Inc.
- Candle Patterns
- Candlestick Charting Explained
- Intermarket Technical Analysis
- John Murphy on Chart Analysis
- John Murphy's Chart Pattern Recognition
- John Murphy's Market Message
- MurphyExplainsMarketAnalysis-Intermarket Analysis
- MurphyExplainsMarketAnalysis-Visual Analysis
- StockCharts.com
- Technical Analysis of the Financial Markets
- The Visual Investor
- VectorVest, Inc.
- Executive Premier Workshop
- One-Day Options Course
- OptionsPro
- Retirement Income Workshop
- Sure-Fire Trading Systems (VectorVest, Inc.)
- Trading as a Business Workshop
- VectorVest 7 EOD
- VectorVest 7 RealTime/IntraDay
- VectorVest AutoTester
- VectorVest Educational Services
- VectorVest OnLine
- VectorVest Options Analyzer
- VectorVest ProGraphics v6.0
- VectorVest ProTrader 7
- VectorVest RealTime Derby Tool
- VectorVest Simulator
- VectorVest Variator
- VectorVest Watchdog
