HOT TOPICS LIST
- MACD
- Fibonacci
- RSI
- Gann
- ADXR
- Stochastics
- Volume
- Triangles
- Futures
- Cycles
- Volatility
- ZIGZAG
- MESA
- Retracement
- Aroon
INDICATORS LIST
LIST OF TOPICS
PRINT THIS ARTICLE
by Ashwani Gujral
PetMed Express Inc. (PETS) broke down from a double top, then had a relief rally only to find resistance again near the double top and selling on heavy volume. If you missed the double top breakdown, the relief rally after the breakdown is a good point to sell.
Position: N/A
Ashwani Gujral
He is founder of AGIP Securities Pvt. Ltd. which offers money management services, live chat rooms (during market hours) and independent technical analysis consultancy. The company has a big media presence from the likes of CNBC, NDTV Profit, and ZEE Business.
PRINT THIS ARTICLE
DOUBLE TOPS
PetMed Express Inc. Breaks Down
06/11/04 01:33:29 PMby Ashwani Gujral
PetMed Express Inc. (PETS) broke down from a double top, then had a relief rally only to find resistance again near the double top and selling on heavy volume. If you missed the double top breakdown, the relief rally after the breakdown is a good point to sell.
Position: N/A
| Double tops are susceptible to mistaken identity. This is because traders often take any two highs and call them a double top. A double top is formed when a stock makes one high, then corrects and after several periods makes another attempt at the previous high, this time on lower volume, and then sells off. Subsequent to this breakdown below the previous bottom (this previous bottom is often used as a horizontal baseline), the stock then tests its logical target, that being the difference between the horizontal line and tops deducted from the horizontal line. Once this target is reached, there is sometimes a relief rally that finds resistance at the horizontal line and the stock finally starts declining again. This relief rally can provide one of the best trades related to the double top. This rally often happens on lower volumes and has a defined target, hence offering a perfect shorting opportunity. |

|
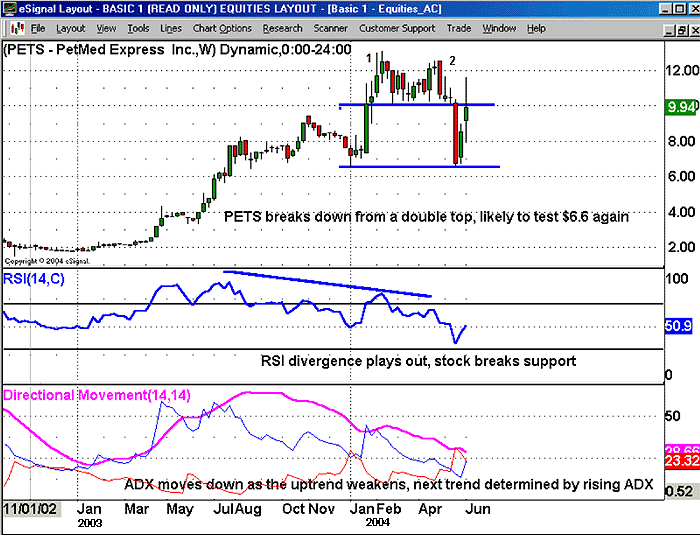
| Figure 1: Weekly chart of PETS. |
| Graphic provided by: eSignal. |
| |
| On the weekly chart, PETS has broken down from a double top and achieved its logical target of approximately $6. This is calculated by subtracting the $3 distance from double top to the horizontal line at $9, from the horizontal line itself. A negative divergence has played out in the RSI where the stock retested its high and made a lower top on the RSI. Unless the stock crosses its previous high of about $13, it is in a downtrend. The candlestick with the long shadow confirms a high level of selling. ADX has declined to a low value from higher levels as distribution took place in the stock and it now seems ready to trend. Long-term traders can short this stock at the current market price of about $10 with a stop at the high of the last bar (the long-legged candle) at about $12, and trail their stop until $6.6. The stock could see further losses below $6.6. |
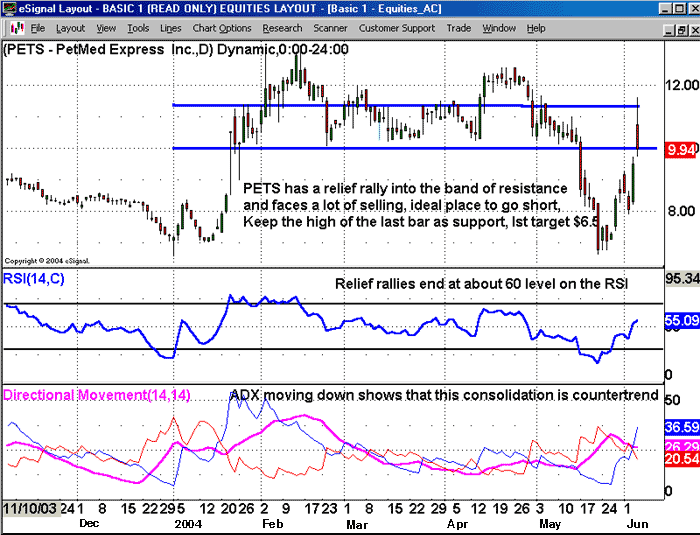
 Figure 2: Daily chart of PETS. On the daily chart, PETS opened in the last session (6/9/04) with a gap and finally faced so much selling that it closed below its open, near its low. This shows the relief rally has ended and the stock is ready to move lower. RSI dips into oversold territory and then rises again to about the 60 level, ready to be sold into again. When stocks are in downtrends the pullbacks often end when the RSI reaches the 60 level. The ADX, which was indicating a consolidation, is likely to gain strength as the stock moves lower. Once again, double tops can be tricky. The formation is characterized by the failure of a stock to make a new high after correcting from a previous high, and both highs need a sufficient lapse in time between them in order for the double top to be valid. |
He is founder of AGIP Securities Pvt. Ltd. which offers money management services, live chat rooms (during market hours) and independent technical analysis consultancy. The company has a big media presence from the likes of CNBC, NDTV Profit, and ZEE Business.
| Title: | Chief mkt strategist |
| Company: | AGIP Securities |
| India | |
| Phone # for sales: | 9871066337 |
| Website: | www.ashwanigujral.com |
| E-mail address: | contact@ashwanigujral.com |
Traders' Resource Links | |
| AGIP Securities has not added any product or service information to TRADERS' RESOURCE. | |
Click here for more information about our publications!
PRINT THIS ARTICLE

Request Information From Our Sponsors
- StockCharts.com, Inc.
- Candle Patterns
- Candlestick Charting Explained
- Intermarket Technical Analysis
- John Murphy on Chart Analysis
- John Murphy's Chart Pattern Recognition
- John Murphy's Market Message
- MurphyExplainsMarketAnalysis-Intermarket Analysis
- MurphyExplainsMarketAnalysis-Visual Analysis
- StockCharts.com
- Technical Analysis of the Financial Markets
- The Visual Investor
- VectorVest, Inc.
- Executive Premier Workshop
- One-Day Options Course
- OptionsPro
- Retirement Income Workshop
- Sure-Fire Trading Systems (VectorVest, Inc.)
- Trading as a Business Workshop
- VectorVest 7 EOD
- VectorVest 7 RealTime/IntraDay
- VectorVest AutoTester
- VectorVest Educational Services
- VectorVest OnLine
- VectorVest Options Analyzer
- VectorVest ProGraphics v6.0
- VectorVest ProTrader 7
- VectorVest RealTime Derby Tool
- VectorVest Simulator
- VectorVest Variator
- VectorVest Watchdog
