HOT TOPICS LIST
- MACD
- Fibonacci
- RSI
- Gann
- ADXR
- Stochastics
- Volume
- Triangles
- Futures
- Cycles
- Volatility
- ZIGZAG
- MESA
- Retracement
- Aroon
INDICATORS LIST
LIST OF TOPICS
PRINT THIS ARTICLE
by David Penn
Silver spent April going down in nearly a straight line. Will silver spend June moving back up?
Position: N/A
David Penn
Technical Writer for Technical Analysis of STOCKS & COMMODITIES magazine, Working-Money.com, and Traders.com Advantage.
PRINT THIS ARTICLE
MACD
July Silver: Bottom Or Breakdown?
06/10/04 01:29:27 PMby David Penn
Silver spent April going down in nearly a straight line. Will silver spend June moving back up?
Position: N/A
| In one of the figures for my last article on silver ("Silver's Slippery Symmetrical Triangle," Traders.com Advantage, April 22, 2004), I noted that "if the April lows (were) taken out, then a continued correction in May silver could see the March lows surpassed as well." At the time, May silver was trading just under $7, and the "April lows" were a few cents lower at $6.80, with the "March lows" a few cents lower still at about $6.60. What a difference a few months make! |
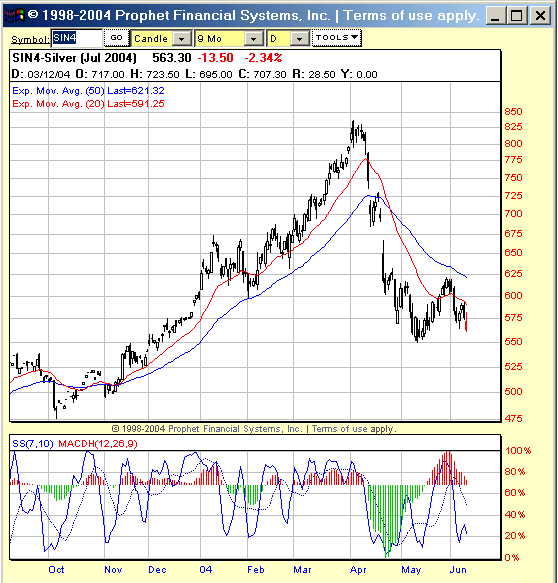
| Silver (basis July) was last trading at $5.60-odd cents, in the process of reaching that level taking out not only the April and March lows, but the February and January lows as well. Since May, July silver has been doing some measure of consolidation, bouncing up toward resistance at the 50-day exponential moving average late in the month, before slipping back toward the May lows here in early June. Has silver bottomed, or does the June retreat from the mid-May countertrend rally suggest that a fresh breakdown lies ahead of July silver as soon as the May lows are taken out? |

|
| Is the correction in silver over? Or is there more downside to come on the other side of the May 2004 lows? |
| Graphic provided by: Prophet Financial Systems, Inc. |
| |
| In support of the argument for a bottom is the positive divergence that has developed between the stochastic troughs in late April and mid-May and the price troughs of the same time. Another argument in favor of an (at least temporary) bottom comes in the form of the exceptionally deep MACDH trough that formed in April as silver prices collapsed. As I have written elsewhere for Traders.com Advantage and Working-Money.com , such troughs often mark the initial post-peak decline. As such, a bounce of some magnitude should not be unexpected in silver prices -- perhaps a bounce powerful enough to fill one of the gaps silver prices made on the way down (the lower is at $6.75, the higher is near $7.25). |
| Also worth noting is that silver is powerfully oversold at present. There is bearish news on the MACDH front. Notice how the MACDH formed a peak during the May rally in silver. I have found that when such peaks accompany a price that is below intermediate-term moving averages -- such as the 50-day EMA -- they often represent temporarily overbought markets that are ripe for reversal. Should the reversal show follow-through to the downside, the breakdown point is about $5.50, representing the May lows. Based on a swing rule projection around those lows, a move down in July silver to the $4.75 level should be expected in the event that it is a breakdown, not a bottom, that is coming to July silver. |
Technical Writer for Technical Analysis of STOCKS & COMMODITIES magazine, Working-Money.com, and Traders.com Advantage.
| Title: | Technical Writer |
| Company: | Technical Analysis, Inc. |
| Address: | 4757 California Avenue SW |
| Seattle, WA 98116 | |
| Phone # for sales: | 206 938 0570 |
| Fax: | 206 938 1307 |
| Website: | www.Traders.com |
| E-mail address: | DPenn@traders.com |
Traders' Resource Links | |
| Charting the Stock Market: The Wyckoff Method -- Books | |
| Working-Money.com -- Online Trading Services | |
| Traders.com Advantage -- Online Trading Services | |
| Technical Analysis of Stocks & Commodities -- Publications and Newsletters | |
| Working Money, at Working-Money.com -- Publications and Newsletters | |
| Traders.com Advantage -- Publications and Newsletters | |
| Professional Traders Starter Kit -- Software | |
Click here for more information about our publications!
Comments

|

Request Information From Our Sponsors
- StockCharts.com, Inc.
- Candle Patterns
- Candlestick Charting Explained
- Intermarket Technical Analysis
- John Murphy on Chart Analysis
- John Murphy's Chart Pattern Recognition
- John Murphy's Market Message
- MurphyExplainsMarketAnalysis-Intermarket Analysis
- MurphyExplainsMarketAnalysis-Visual Analysis
- StockCharts.com
- Technical Analysis of the Financial Markets
- The Visual Investor
- VectorVest, Inc.
- Executive Premier Workshop
- One-Day Options Course
- OptionsPro
- Retirement Income Workshop
- Sure-Fire Trading Systems (VectorVest, Inc.)
- Trading as a Business Workshop
- VectorVest 7 EOD
- VectorVest 7 RealTime/IntraDay
- VectorVest AutoTester
- VectorVest Educational Services
- VectorVest OnLine
- VectorVest Options Analyzer
- VectorVest ProGraphics v6.0
- VectorVest ProTrader 7
- VectorVest RealTime Derby Tool
- VectorVest Simulator
- VectorVest Variator
- VectorVest Watchdog
