HOT TOPICS LIST
- MACD
- Fibonacci
- RSI
- Gann
- ADXR
- Stochastics
- Volume
- Triangles
- Futures
- Cycles
- Volatility
- ZIGZAG
- MESA
- Retracement
- Aroon
INDICATORS LIST
LIST OF TOPICS
PRINT THIS ARTICLE
by Sean Moore
April proved to be a tumultuous month for the technology-based Nasdaq Composite Index. From a charting standpoint, the sharp April sell-off within the index followed a picture-perfect double top formation.
Position: Sell
Sean Moore
Traders.com Staff Writer.
PRINT THIS ARTICLE
DOUBLE TOPS
Double Top Formation on the Nasdaq
05/15/00 10:50:24 AMby Sean Moore
April proved to be a tumultuous month for the technology-based Nasdaq Composite Index. From a charting standpoint, the sharp April sell-off within the index followed a picture-perfect double top formation.
Position: Sell
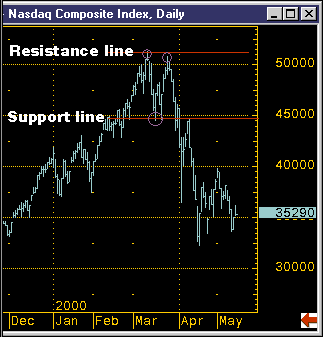
| The chart in Figure 1 displays the open, high, low, and close bars for the Nasdaq Composite Index over the past few months. After several months of large gains and new record highs, the index climbed above the 5000 mark for the first time in early March, 2000. This point, the first top of the double top formation, is circled in purple on the chart. A pullback to the 4500 level followed, setting up a line of support. The index then climbed back up to 5000 (upper-right circle) and tested the resistance line. Unable to close above this line of resistance, the price fell, setting up a classic double top formation. |
| A sell signal was produced as the index's value broke below the support line around the first of April. This was followed by a sharp sell-off, to around the 3600 level, signifying a serious blow to the technology sector. After a few highly volatile days, the sector was able to recover as investors started putting money back into these highly regarded technology stocks. What had been a point of support, at the 4500 level, was now a line of resistance. The index was able to recover enough to test this resistance line, but was unable break through it. This provided a second sell opportunity. Since testing the resistance at 4500, the index value has plummeted all the way into the 3200s and been unable to break the 4000 barrier. |

|
| Figure 1: Daily chart of the Nasdaq Composite Index. This is a classic example of the double top formation. |
| Graphic provided by: CQG. |
| |
| Being able to recognize this type of double top formation can certainly help save profits. More often than not, a security following this formation will react just as the Nasdaq did last month. |
Traders.com Staff Writer.
| Title: | Project Engineer |
| Company: | Technical Analysis, Inc. |
| Address: | 4757 California Ave. SW |
| Seattle, WA 98116 | |
| Phone # for sales: | 206 938 0570 |
| Fax: | 206 938 1307 |
| Website: | Traders.com |
| E-mail address: | smoore@traders.com |
Traders' Resource Links | |
| Charting the Stock Market: The Wyckoff Method -- Books | |
| Working-Money.com -- Online Trading Services | |
| Traders.com Advantage -- Online Trading Services | |
| Technical Analysis of Stocks & Commodities -- Publications and Newsletters | |
| Working Money, at Working-Money.com -- Publications and Newsletters | |
| Traders.com Advantage -- Publications and Newsletters | |
| Professional Traders Starter Kit -- Software | |
Click here for more information about our publications!
Comments

Request Information From Our Sponsors
- VectorVest, Inc.
- Executive Premier Workshop
- One-Day Options Course
- OptionsPro
- Retirement Income Workshop
- Sure-Fire Trading Systems (VectorVest, Inc.)
- Trading as a Business Workshop
- VectorVest 7 EOD
- VectorVest 7 RealTime/IntraDay
- VectorVest AutoTester
- VectorVest Educational Services
- VectorVest OnLine
- VectorVest Options Analyzer
- VectorVest ProGraphics v6.0
- VectorVest ProTrader 7
- VectorVest RealTime Derby Tool
- VectorVest Simulator
- VectorVest Variator
- VectorVest Watchdog
- StockCharts.com, Inc.
- Candle Patterns
- Candlestick Charting Explained
- Intermarket Technical Analysis
- John Murphy on Chart Analysis
- John Murphy's Chart Pattern Recognition
- John Murphy's Market Message
- MurphyExplainsMarketAnalysis-Intermarket Analysis
- MurphyExplainsMarketAnalysis-Visual Analysis
- StockCharts.com
- Technical Analysis of the Financial Markets
- The Visual Investor
