HOT TOPICS LIST
- MACD
- Fibonacci
- RSI
- Gann
- ADXR
- Stochastics
- Volume
- Triangles
- Futures
- Cycles
- Volatility
- ZIGZAG
- MESA
- Retracement
- Aroon
INDICATORS LIST
LIST OF TOPICS
PRINT THIS ARTICLE
by Kevin Hopson
The bullish percent chart for precious metals could indicate a buying opportunity very soon.
Position: N/A
Kevin Hopson
Kevin has been a technical analyst for roughly 10 years now. Previously, Kevin owned his own business and acted as a registered investment advisor, specializing in energy. He was also a freelance oil analyst for Orient Trading Co., a commodity futures trading firm in Japan. Kevin is currently a freelance writer.
PRINT THIS ARTICLE
TECHNICAL ANALYSIS
Time To Consider Precious Metals
06/07/04 01:28:48 PMby Kevin Hopson
The bullish percent chart for precious metals could indicate a buying opportunity very soon.
Position: N/A
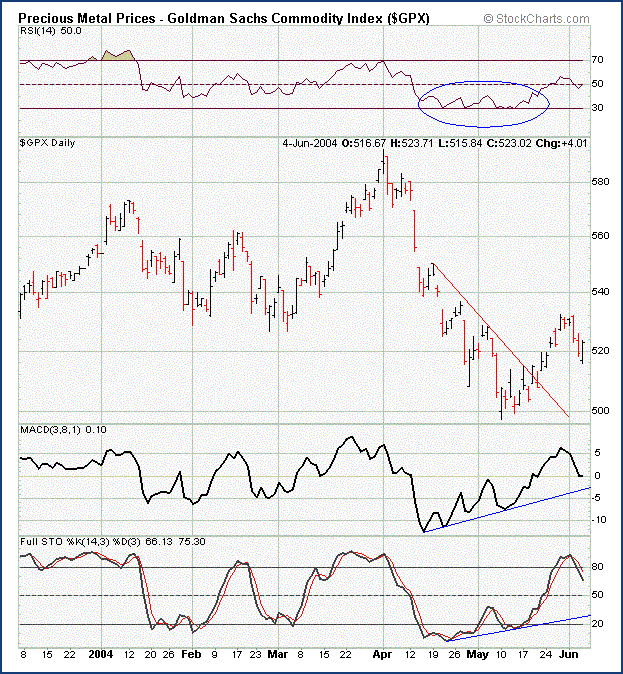
| Precious metal prices have been in a steep decline since early April, as illustrated in the six-month chart of the Goldman Sachs Commodity Index ($GPX). However, you will notice that there have been several bullish divergences on the daily chart. More specifically, the relative strength index (RSI) traded sideways from mid-April to mid-May while prices continued to decline. The moving average convergence/divergence (MACD) and full stochastics - on the other hand - proceeded to move higher. As I have stated in many of my prior articles, bullish divergences such as these tend to indicate a forthcoming bottom. As you can see in the chart, a short-term bottom - at minimum - has occurred. |

|
| Figure 1: Daily chart of $GPX. |
| Graphic provided by: Stockcharts.com. |
| |
| Just because precious metal prices have seen a short-term bottom does not mean it is time to buy. However, looking at the bullish percent for precious metal stocks, the time to buy may not be far off. To explain, the bullish percent is the percentage of companies currently on buy signals. A buy signal is given when a stock breaches a prior high on a point & figure chart. For a stock to stay on a buy signal, prices cannot breach a prior low, which would then result in a sell signal. For further information on point & figure charting and bullish percent charts, you can visit http://dorseywright.com. |
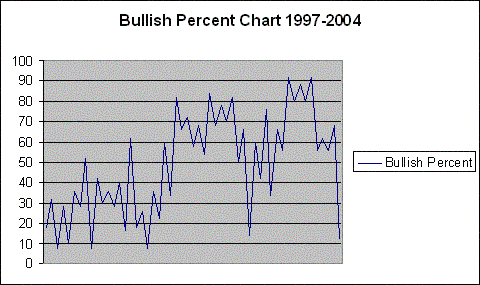
 Figure 2: Bullish Percentage chart for $GPX. Looking at the seven-year bullish percent chart for precious metal stocks, the percentage of companies currently on buy signals is nearing its ultimate lows. The lowest the bullish percent has been since 1997 is eight percent. Since it recently hit a low of 12 percent and is currently around 15 percent, the downside appears to be limited. Additionally, precious metal stocks have the lowest bullish percent out of all of the industries in the market. This means the long-term upside potential for these stocks is significant. For the bullish percent chart to be effective, you have to know how to use it. Like the RSI and stochastics indicators, the bullish percent chart represents overbought (70% and above) and oversold (30% and lower) levels. Conditions can become more overbought or more oversold, so hitting extreme levels on the chart does not necessarily translate to a buy or sell signal (although it can help reduce risk by showing upside potential versus downside potential). |
| This is why you should watch the 30 percent level very carefully. If the bullish percent reverses off its recent low (hits 18 percent) but still remains below the 30 percent level, it would put the group in "Bull Alert" status. This would be a good time to start building positions in precious metal stocks. If the bullish percent exceeds a prior high and moves above the 30 percent level, it would put the group in "Bull Confirmed" status. At this point in time, you would likely benefit by taking full positions in these stocks. Currently, precious metal stocks are still in a confirmed bear market and the bullish percent has not indicated otherwise. But keep a close eye on these stocks, as a change in the bullish percent could present a great buying opportunity. |
Kevin has been a technical analyst for roughly 10 years now. Previously, Kevin owned his own business and acted as a registered investment advisor, specializing in energy. He was also a freelance oil analyst for Orient Trading Co., a commodity futures trading firm in Japan. Kevin is currently a freelance writer.
| Glen Allen, VA | |
| E-mail address: | hopson_1@yahoo.com |
Click here for more information about our publications!
Comments
Date: 06/22/04Rank: 4Comment:
Date: 06/22/04Rank: 4Comment:
Date: 06/26/04Rank: 4Comment:

Request Information From Our Sponsors
- StockCharts.com, Inc.
- Candle Patterns
- Candlestick Charting Explained
- Intermarket Technical Analysis
- John Murphy on Chart Analysis
- John Murphy's Chart Pattern Recognition
- John Murphy's Market Message
- MurphyExplainsMarketAnalysis-Intermarket Analysis
- MurphyExplainsMarketAnalysis-Visual Analysis
- StockCharts.com
- Technical Analysis of the Financial Markets
- The Visual Investor
- VectorVest, Inc.
- Executive Premier Workshop
- One-Day Options Course
- OptionsPro
- Retirement Income Workshop
- Sure-Fire Trading Systems (VectorVest, Inc.)
- Trading as a Business Workshop
- VectorVest 7 EOD
- VectorVest 7 RealTime/IntraDay
- VectorVest AutoTester
- VectorVest Educational Services
- VectorVest OnLine
- VectorVest Options Analyzer
- VectorVest ProGraphics v6.0
- VectorVest ProTrader 7
- VectorVest RealTime Derby Tool
- VectorVest Simulator
- VectorVest Variator
- VectorVest Watchdog
