

HOT TOPICS LIST
- MACD
- Fibonacci
- RSI
- Gann
- ADXR
- Stochastics
- Volume
- Triangles
- Futures
- Cycles
- Volatility
- ZIGZAG
- MESA
- Retracement
- Aroon
INDICATORS LIST
LIST OF TOPICS
PRINT THIS ARTICLE
by Gary Grosschadl
The Nasdaq may rise above 2000 this week but a confluence of resistance lurks nearby.
Position: Hold
Gary Grosschadl
Independent Canadian equities trader and technical analyst based in Peterborough
Ontario, Canada.
PRINT THIS ARTICLE
CHART ANALYSIS
Nasdaq's Limited Upside Potential
06/07/04 01:15:48 PMby Gary Grosschadl
The Nasdaq may rise above 2000 this week but a confluence of resistance lurks nearby.
Position: Hold
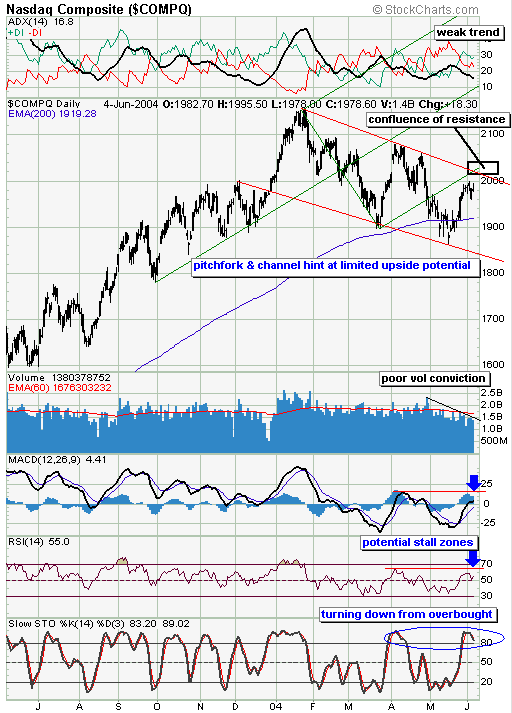
| It may be tempting to assume that all is well if the Nasdaq rises above 2000. Looking at this chart hints that the bigger test lies 20 to 40 points above that psychological level. |
| This daily chart offers two pattern considerations, the first being a downsloping red channel, and the other a pitchfork pattern. The top of the channel is the 2030 area and this region should be carefully watched as stiff resistance could be encountered. Failure here could start a downleg to test the bottom trendline around 180 points lower. Optimists could be right in viewing this channel as a large bull flag but this has yet to be proven. |
|
| Daily chart of the Nasdaq index showing an overhead confluence of likely resistance. |
| Graphic provided by: Stockcharts.com. |
| |
| The second pattern shown is a green pitchfork. Choosing significant turning points to anchor the Andrews Pitchfork is as much art as science. The three pivot points chosen result in very plausible trendlines and that is an important element in drawing pitchforks - they have to look "right." This pitchfork shows a failure occuring early in May when the lower median line was violated. Now a retest of that mark is nearby. This area is so close to the above-mentioned pitchfork mark that it becomes a possible strong confluence of resistance. |
| The indicators worth considering include the weak ADX (on the topmost graph), which shows a weakening trend in this latest upleg. The MACD (moving average convergence/divergence) and the RSI (relative strength index) hint at possible stall areas. The stochastics indicator shows a turning down from overbought levels and this is more compelling as a weak trend is indicated by the above points. This could lead to a larger stochastic downleg as in the past. |
| In summary, limited upside could be in store unless a convincing and sustainable move occurs that puts the Nasdaq back inside the pitchfork and to the upside of the downsloping red channel. The market should tell us soon enough. A big move may be developing, but which way? |
Independent Canadian equities trader and technical analyst based in Peterborough
Ontario, Canada.
| Website: | www.whatsonsale.ca/financial.html |
| E-mail address: | gwg7@sympatico.ca |
Click here for more information about our publications!
Comments
Date:�06/08/04Rank:�5Comment:�
Date:�06/09/04Rank:�5Comment:�

Request Information From Our Sponsors
- VectorVest, Inc.
- Executive Premier Workshop
- One-Day Options Course
- OptionsPro
- Retirement Income Workshop
- Sure-Fire Trading Systems (VectorVest, Inc.)
- Trading as a Business Workshop
- VectorVest 7 EOD
- VectorVest 7 RealTime/IntraDay
- VectorVest AutoTester
- VectorVest Educational Services
- VectorVest OnLine
- VectorVest Options Analyzer
- VectorVest ProGraphics v6.0
- VectorVest ProTrader 7
- VectorVest RealTime Derby Tool
- VectorVest Simulator
- VectorVest Variator
- VectorVest Watchdog
- StockCharts.com, Inc.
- Candle Patterns
- Candlestick Charting Explained
- Intermarket Technical Analysis
- John Murphy on Chart Analysis
- John Murphy's Chart Pattern Recognition
- John Murphy's Market Message
- MurphyExplainsMarketAnalysis-Intermarket Analysis
- MurphyExplainsMarketAnalysis-Visual Analysis
- StockCharts.com
- Technical Analysis of the Financial Markets
- The Visual Investor