HOT TOPICS LIST
- MACD
- Fibonacci
- RSI
- Gann
- ADXR
- Stochastics
- Volume
- Triangles
- Futures
- Cycles
- Volatility
- ZIGZAG
- MESA
- Retracement
- Aroon
INDICATORS LIST
LIST OF TOPICS
PRINT THIS ARTICLE
by Kevin Hopson
The stock is starting to break down but is it time to sell?
Position: Hold
Kevin Hopson
Kevin has been a technical analyst for roughly 10 years now. Previously, Kevin owned his own business and acted as a registered investment advisor, specializing in energy. He was also a freelance oil analyst for Orient Trading Co., a commodity futures trading firm in Japan. Kevin is currently a freelance writer.
PRINT THIS ARTICLE
TECHNICAL ANALYSIS
Caution For Plains Exploration & Production
06/04/04 10:00:22 AMby Kevin Hopson
The stock is starting to break down but is it time to sell?
Position: Hold
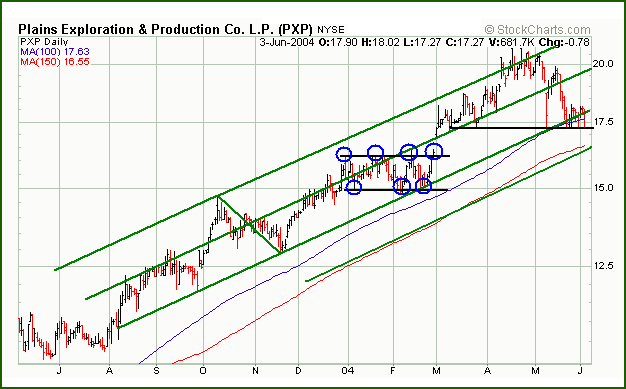
| Plains Exploration & Production Co. (PXP) has been in a nice steady uptrend since last August, as illustrated by the one-year chart. You will notice that prices have been contained within the reverse pitchfork configuration (green trendlines) during this time, and then broke out of a bullish trading range in the middle of this uptrend. |
| If you take the number of times that Plains tested the top channel line in alternate sequence before breaking out (4), multiply this number by the width of the trading range ($16.25 - $15.00 = $1.25) and then add this figure (4 x $1.25 = $5.00) to the bottom ($15.00 + $5.00 = $20.00) and top ($16.25 + $5.00 = $21.25) channel lines, you come up with a rough price target of $20.00 to $21.25. |

|
| Graphic provided by: Stockcharts.com. |
| |
| The stock topped out just below the $21.00 level back in April, meaning that the trading range breakout calculation was accurate. Unfortunately, Plains has now breached support along the bottom green parallel line, as well as its 100-day moving average ($17.63). Since the trading range breakout accurately predicted a turning point in the stock and the technicals are starting to break down, it seems like it is time to get out. |
| Though the warning signs are there, it might be better to give the stock the benefit of the doubt. The stock is currently testing support in the $17.00 to $17.25 range, the site of a multiple bottom and the 61.8 percent retracement level from the February-April rally. Even if this price range fails to hold, there is additional support around $16.50, which is the site of the stock's 150-day moving average ($16.55) and the unfilled gap from March's breakout. |
| If I draw a trendline parallel to the bottom line of the green pitchfork (at an equal width to the other two pitchfork channels), I can project another potential bouncing point. As you can see, this trendline converges around the $16.50 level, where there is already a significant confluence of support. Therefore, I would continue to hold shares of Plains Exploration & Production but remain cautious in the near-term. If the $16.50 level is taken out, I might consider lightening up. |
Kevin has been a technical analyst for roughly 10 years now. Previously, Kevin owned his own business and acted as a registered investment advisor, specializing in energy. He was also a freelance oil analyst for Orient Trading Co., a commodity futures trading firm in Japan. Kevin is currently a freelance writer.
| Glen Allen, VA | |
| E-mail address: | hopson_1@yahoo.com |
Click here for more information about our publications!
PRINT THIS ARTICLE

Request Information From Our Sponsors
- StockCharts.com, Inc.
- Candle Patterns
- Candlestick Charting Explained
- Intermarket Technical Analysis
- John Murphy on Chart Analysis
- John Murphy's Chart Pattern Recognition
- John Murphy's Market Message
- MurphyExplainsMarketAnalysis-Intermarket Analysis
- MurphyExplainsMarketAnalysis-Visual Analysis
- StockCharts.com
- Technical Analysis of the Financial Markets
- The Visual Investor
- VectorVest, Inc.
- Executive Premier Workshop
- One-Day Options Course
- OptionsPro
- Retirement Income Workshop
- Sure-Fire Trading Systems (VectorVest, Inc.)
- Trading as a Business Workshop
- VectorVest 7 EOD
- VectorVest 7 RealTime/IntraDay
- VectorVest AutoTester
- VectorVest Educational Services
- VectorVest OnLine
- VectorVest Options Analyzer
- VectorVest ProGraphics v6.0
- VectorVest ProTrader 7
- VectorVest RealTime Derby Tool
- VectorVest Simulator
- VectorVest Variator
- VectorVest Watchdog
