HOT TOPICS LIST
- MACD
- Fibonacci
- RSI
- Gann
- ADXR
- Stochastics
- Volume
- Triangles
- Futures
- Cycles
- Volatility
- ZIGZAG
- MESA
- Retracement
- Aroon
INDICATORS LIST
LIST OF TOPICS
PRINT THIS ARTICLE
by Jayanthi Gopalakrishnan
Catching a stock that is breaking out of its trading range during the early stage can result in a profitable trade.
Position: Buy
Jayanthi Gopalakrishnan
PRINT THIS ARTICLE
BREAKOUTS
Breakouts
05/12/00 01:36:01 PMby Jayanthi Gopalakrishnan
Catching a stock that is breaking out of its trading range during the early stage can result in a profitable trade.
Position: Buy
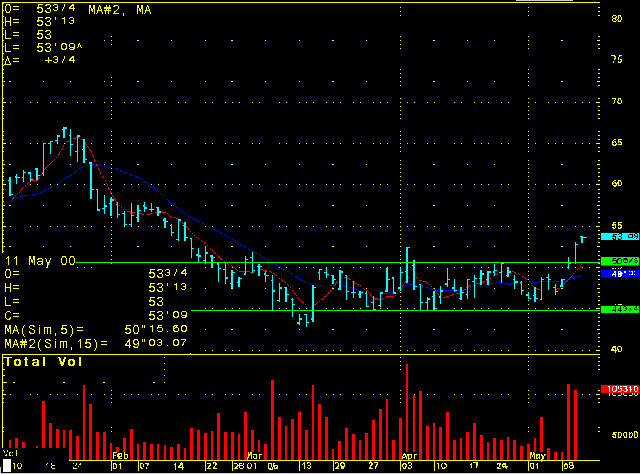
| In the accompanying chart, Coca-Cola Co. (KO) showed evidence that it was breaking out of the trading range that it had been in since mid-March. The price gapped up at the open and closed at the high of its trading range. Note the increase in trading volume. There are occasions when such a scenario may prove to be a false breakout, and you can see that a similar breakout occurred on 4/4/00 but quickly retreated back into its trading range. |
| In order to determine if the activity on 5/9/00 is the beginning of a breakout, you'll have to watch the activity on the following day. On 5/10/00 prices did continue their upward movement and stayed above the trading range accompanied by higher-than-average volume. Additionally, the faster moving average had crossed above the slower moving average, another confirming signal. |

|
| Graphic provided by: CQG Net. |
| |
| Title: | Editor |
| Company: | Technical Analysis of Stocks & Commodities |
| Address: | 4757 California Ave SW |
| Seattle, WA 98116 | |
| Website: | Traders.com |
| E-mail address: | Jayanthi@traders.com |
Traders' Resource Links | |
| Charting the Stock Market: The Wyckoff Method -- Books | |
| Working-Money.com -- Online Trading Services | |
| Traders.com Advantage -- Online Trading Services | |
| Technical Analysis of Stocks & Commodities -- Publications and Newsletters | |
| Working Money, at Working-Money.com -- Publications and Newsletters | |
| Traders.com Advantage -- Publications and Newsletters | |
| Professional Traders Starter Kit -- Software | |
Click here for more information about our publications!
Comments
Date: / /Rank: 4Comment: Chart resolution seems to be a problem. I have to sort of pretend to see the moving average lines.

Request Information From Our Sponsors
- StockCharts.com, Inc.
- Candle Patterns
- Candlestick Charting Explained
- Intermarket Technical Analysis
- John Murphy on Chart Analysis
- John Murphy's Chart Pattern Recognition
- John Murphy's Market Message
- MurphyExplainsMarketAnalysis-Intermarket Analysis
- MurphyExplainsMarketAnalysis-Visual Analysis
- StockCharts.com
- Technical Analysis of the Financial Markets
- The Visual Investor
- VectorVest, Inc.
- Executive Premier Workshop
- One-Day Options Course
- OptionsPro
- Retirement Income Workshop
- Sure-Fire Trading Systems (VectorVest, Inc.)
- Trading as a Business Workshop
- VectorVest 7 EOD
- VectorVest 7 RealTime/IntraDay
- VectorVest AutoTester
- VectorVest Educational Services
- VectorVest OnLine
- VectorVest Options Analyzer
- VectorVest ProGraphics v6.0
- VectorVest ProTrader 7
- VectorVest RealTime Derby Tool
- VectorVest Simulator
- VectorVest Variator
- VectorVest Watchdog
